Yass Valley

Local Profile for Yass Valley Council

Yass Valley Local Government Area
Click Here
Slide 2 Heading
Lorem ipsum dolor sit amet consectetur adipiscing elit dolor
Click Here
Slide 3 Heading
Lorem ipsum dolor sit amet consectetur adipiscing elit dolor
Click Here
Slide Heading
Lorem ipsum dolor sit amet, consectetur adipiscing elit. Ut elit tellus, luctus nec ullamcorper mattis, pulvinar dapibus leo.
Click Here
Slide Heading
Lorem ipsum dolor sit amet, consectetur adipiscing elit. Ut elit tellus, luctus nec ullamcorper mattis, pulvinar dapibus leo.
Click Here

Yass Valley Council (Council) is situated approximately 280km south-west of Sydney and 60km north-west of Canberra. The Council Local Government Area (LGA) covers a land area of approximately and has an LGA size of approximately 3,995 square kilometres.

Bounding the Council is the Hilltops Council and Upper Lachlan Shire to the north, Queanbeyan-Palerang Regional Council to the east, the Australian Capital Territory (ACT) and Snowy Valleys Council area in the south, and the Cootamundra-Gundagai Regional Council to the west.

The original inhabitants of Yass Valley were the Ngunnawal and Wirarjuri people, and the valley is thought to be named from the Aboriginal word for ‘running water’. ¹ The Ngunnawal people are recognised as the traditional custodians of the Yass Valley. ²

As of 2021, Council a population of 17,234 which primarily reside in the main township of Yass and villages including Binalong, Bookham, Bowning and Gundaroo.

Traversing the Yass Valley area is the Hume Highway (the busiest interstate freight corridor in Australia), Barton Highway, Federal Highway and the main southern railway line.

Socio-demographic profile

In 2024, the estimated residential population for Yass Valley Council was 17,647 people. ³

In 2021, based on the Australian Bureau of Statistics (ABS) 2021 census data, Yass Valley Council consisted of:

  • LGA size – 3,995 square kilometres; ⁴
  • Total population – 17,281 people; ⁵
  • Aboriginal and Torres Strait Islander population – 3.2% (550 persons); ⁶
  • No of properties/dwellings – 6,830; ⁷
  • Persons aged under 5 – 5.4% (928 persons); ⁸
  • Persons aged over 65 – 18.42% (3,174 persons); ⁹
  • Persons with disability – 5.4% (926 persons); 10
  • No of new residents from overseas (2016 – 2021) – 102; 11
  • Persons culturally and linguistically diverse (CALD) / non English speaking at home – 4.1% (707 persons); and 12
  • Top 5 languages spoken at home are German, Mandarin, Arabic, Italian, Croatian. 13

Based on recently revised population projects from the NSW Department of Planning, the population of the LGA is expected to grow by 1.1% per annum to 20,824 people in 2041 (-448 by natural change and +4,032 from migration). A link to further information outlining growth trends in Yass Valley Council, including graphs can be found here: https://www.planning.nsw.gov.au/data-and-insights/population-projections/explore-the-data.

Economic profile

As of 2021, agricultural productivity in Yass Valley was valued at $89 million with livestock slaughtered (sheep and cattle) accounting for approximately $50 million (55%) of the total agricultural productivity. This was followed by livestock products, mostly wool, at 17%. 14

The top three industries employing local workers in Yass Valley Council in the 2022/2023 financial year was:

  • Construction (23.9%);
  • Agriculture, Forestry and Fishing (12.7%); and
  • Health Care and Social Assistance (10.5%).

For Yass Valley Council in the 2022/23 financial year:

  • Rental, Hiring and Real Estate Services had the highest productivity by industry, generating $370,178 per worker; 15
  • The Gross Regional Product was $0.87 billion in the year ending June 2023, growing 6.7% since the previous year 16
  • Tourism sales in Yass Valley Council were $68.1m (total value added was $31.6m).

Environmental profile

The Yass Valley Council area is characterised by a diverse landscape including rolling hills and valleys, waterways and Burrinjuck Dam. The area is known for the impressive geological cave and fossil formations dating over 400 million years. The area largely consists of rural lands and rural residential properties which is largely used for agriculture, particularly sheep grazing. The other main land uses include forestry production, and nature conservation.17

Yass Valley Council is wholly within the upper Murrumbidgee Catchment. The Yass River is a major sub-catchment and within the LGA area. The Burrinjuck Reservoir and Goodradigbee River catchments are also located within the LGA. 18

Protected areas in the LGA include five nature reserves, one state conservation area and having part of the Brindabella National Park being located within the south-western part of the LGA.

The bulk of residential areas in the LGA is located in Yass, as the principal township, whilst there are also major townships of Binalong, Bookham, Bowning, Gundaroo, Murrumbateman, Sutton, and Wee Jasper.

Governance profile

Bounding the Council is the Hilltops Council and Upper Lachlan Shire to the north, Queanbeyan-Palerang Regional Council to the east, the Australian Capital Territory (ACT) and Snowy Valleys Council area in the south, and the Cootamundra-Gundagai Regional Council to the west.

The Ngunnawal people are recognised as the traditional custodians of the Yass Valley. 20

The township of Yass is the largest township in the Shire and is the service centre for numerous surrounding smaller townships. Yass was officially gazetted as a township in 1837. Murrumbateman, to the south of Yass is now considered a township. The smaller villages were based on pastoral settlements, with Bowning and Binalong growing around the railway line.  21 The villages located in Yass Valley are at Binalong, Bookham, Bowning, Gundaroo, Sutton and Wee Jasper. 22

The Council has nine elected Councillors for four-year term. The Mayor is elected by the Councillors and is recognised as the civic leader of the community. 23

Hazard Exposure Summary

The LGA is vulnerable to a wide range of natural hazards, making it essential to understand the nature and extent of exposure to people, buildings, infrastructure, services, or natural resources to effectively assess and address associated risks.

Exposure can be seen in various forms:

  • Relative exposure is a function of hazard, describing the frequency and magnitude of natural hazard events and capturing the compounding effect of multiple hazards (fire and flood for this analysis). Where a community is subject to both fire and flood, it is potentially less resilient than one exposed to a single hazard of the same frequency and magnitude;
  • The physical exposure of a community is determined such that the quantum of exposed people, buildings, essential facilities, industry, and agriculture can be evaluated. The physical vulnerability of exposed elements is also important, such as the age and construction type of buildings (for example, buildings with raised floors are more resilient to flood as they provide greater protection to the occupants and their belongings, resulting in less loss of life and property); and
  • Social vulnerability is determined by examining socio-economic and demographic factors that may exacerbate or ameliorate the effects of an external threat to a person’s life, livelihood, or assets. Examples of these types of indicators include age, occupation, health status, income and education.

The Resilience Blueprint identified the following hazards as relevant hazardous events for the southeast NSW region. In 2024 the State Disaster Mitigation Plan (SDMP) was implemented and any additional hazards or information regarding exposure of hazard in the region has been included below:

  Fire (bushfire and grass)

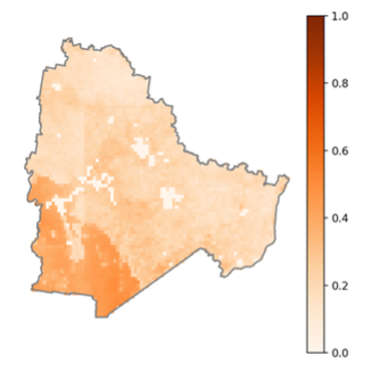
  • Based on information collated from Risk Frontiers, the frequency of dangerous bushfire weather days and the magnitude of bushfire weather extremes will increase in Yass Valley. Earlier onsets of the bushfire season are also predicted;
  • The Southern Tablelands Region (which includes the Upper Lachlan, Yass Valley & Goulburn Mulwaree LGAs) has on average 265 bush fires per year, of which 5 could be considered to be large fires. It is noted that rainfall is both unreliable in the region, and generally at its lowest during the summer months. This is known to result in dry pastures over a large proportion of the shire, increasing grassfire risk; 24
  • A large proportion of Yass Valley is rural in nature which influences the level of bushfire risk. Any increase in bushfires will likely have flow on effects to water quality and availability for the Yass Valley; 25
  • Based on the potential event probability, as provided by Risk Frontiers, annual average loss of residential, commercial and industrial buildings from flood in the LGA is 6 per cent under a RCP 4.5 scenario. This accounts for a low probability of occurring but a high financial cost consequence of bushfire activity;
  • As a result of the 2019-20 bushfires in NSW, an estimated 1,331 tonnes of grapes significantly impacted by smoke taint across the Yass Valley region, with substantial implications for the viticulture; 26
  • There are large pine plantations 3460 hectares of both state and private in the Yass Valley Shire, valued in excess of $15 million. Pine plantations are very susceptible to fire and because of their value prevention of fire is a high priority; and 27
  • Historically, Yass Valley Council has been subject to significant bushfire events, including the Cobbler Road grassfire which occurred overnight on 8-9 January 2013. This started under extreme conditions and covered 14,000 hectares within 6 hours. 28

Actions proposed or taken:

  • Council’s LSPS identifies priorities, and subsequent actions related to bushfire:
    • Planning Priority 2: Focus Growth in Yass and Murrumbateman. Action: ‘Ensure Planning Proposals avoid areas affected by flooding and high bushfire risk and avoid agricultural land use conflict’; and
    • Planning Priority 7: Increase Yass Valley’s Resilience to Climate and Natural Hazards. Action: ‘Ensure current environmental constraints information is made available to inform Planning Proposals and Development Applications including flood planning levels, potentially contaminated land and bushfire risk’.
  • The Southern Tablelands Bush Fire Management Committee updating the Bush Fire Risk Management Plan for Southern Tablelands. It identifies the bush fire risks in Upper Lachlan, Yass Valley & Goulburn Mulwaree LGAs and sets out the types of work scheduled to deal with the risk of bush fires.

 Flooding (flash and riverine)

  • Flooding is a serious risk in Yass Valley. It is estimated that 10.9% of the population, or 1,900 people in Yass Valley are at risk of flooding; 29
  • Floods in Yass Valley are causes by either of 3 weather systems, being: 30
    • Sequences of southern air masses (frontal systems) coming from the Antarctic region and moving in north easterly direction over the catchment;
    • Low-pressure systems located over the east coast of Australia (East Coast Lows) and causing moist airflows over the Snowy Mountains;
    • Short duration, high intensity convective thunderstorms that occur over small areas during summer. These may cause town drainage systems to surcharge and minor creeks to rise rapidly. Such thunderstorms do not cause mainstream riverine flooding.
  • Based on the potential event probability, as provided by Risk Frontiers, annual average loss of residential, commercial and industrial buildings from flood in the LGA is 66 per cent under a RCP 4.5 scenario. This accounts for a high probability occurring and a high financial cost consequence of flood activity;
  • Much of the Yass CBD (including commercial and residential properties along Yass Valley Way) is mapped as being at risk of flooding in a 1% AEP flood event;
  • Yass and the villages have varying degrees of flood risk due to their historical siting adjacent to waterways. Any net increase in flooding will have flow on effects to water quality and availability for the Yass Valley; 31
  • A number of storage dams are located in Yass Valley including Yass Dam and the Burrinjuck Dam. The Yass Dam is found to have negligible flood mitigation affect on peak flow in the Yass River. The Burrinjuck Dam contains high water storage levels within the dam, which may result in the flooding of several caravan parks and camping grounds located on the foreshores of the dam; 32
  • Whilst not formerly recorded, the largest flood in Yass was reportedly the 1900 flood; 33
  • There have been a number of significant flooding events within the Yass Valley LGA, since records began in 1915, including in October 1959, where Yass had its largest flood (on record). The Yass River peaked at approximately 9.8 metres at the Yass Gauge. Floodwaters reached the steps of the Court House and affected business premises and residents in Rossi and Comur Streets. The northern approaches to Hume Bridge were cut for approximately 12 hours. Floods have also been recorded at the Yass Guage for the following dates and heights: 34
    • Friday 31 October 1969 (5.90m);
    • Wednesday 28 August 1974 (7.63m);
    • Thursday 5 September 1974 (5.33m);
    • Friday 18 October 1974 (5.06m);
    • Monday 14 July 1975 (4.23m);
    • Saturday 25 October 1975 (4.18m);
    • Saturday 17 October 1976 (4.86m);35
    • Tuesday 5 September 1978 (4.44m);
    • Saturday 21 September 1985 (4.05m);
    • Wednesday 15 March 1989 (6.84m); and
    • Thursday 13 April 1989 (4.33m).
  • In 2020, major flooding impacted Yass, resulted in more than $427,000 in flood damage to infrastructure (when calculated by Council); and
  • More recently, in August 2022, flooding from the Yass River caused significant damage (greater than $2.5 million). For the 2020 flood, the peak flow rate was 80,000 megalitres a day; the August 2022 flood had a peak flow rate of 125,000 megalitres a day. Flooding was caused by storm activity and resulted in flooding from overland flow and riverine flooding in Yass. 36

Actions taken or proposed:

  • Council’s LSPS identifies the following actions relevant to addressing flood risk as priorities:
    • Complete Flood Studies for Murrumbateman, Bowning, Binalong and Bookham (short-term);
    • Complete Yass Flood Risk Management Study and Plan (short-term);
    • Commence Parkwood Flood Risk Management Study and Plan (medium-term); and
    • Implement development recommendations of Flood Risk Management Studies and Plans into Comprehensive Development Control Plan (short-medium term).
  • Council have also completed several flood studies and floodplain risk management plans to better understand flood risk within the LGA, including: 37
    • Murrumbateman, Bowning, Bookham and Binalong Flood Study 2020 (and the July 2021 update), prepared by Lyall & Associates Pty Ltd;
    • Sutton Floodplain Risk Management Plans 2016, prepared by WMA Water; and
    • Yass Floodplain Risk Management Report 2021, prepared by Lyall & Associates Pty Ltd and Nexus Environmental Planning Pty Ltd.

These strategies also provide and recommend various flood risk measures for these areas to ensure any new development can be aware of any present flood risk.

 Severe storm

  • Severe storms in NSW are often associated with East Coast Lows (ECL). ECL events are extreme weather systems that occur in South-East Australia, bringing extreme winds, rain, hail and lightening;
  • The maximum annual windspeed is projected to increase across the LGA; and
  • Based on the potential event probability, as provided by Risk Frontiers, annual average loss of residential, commercial and industrial buildings from hail damage associated with a storm in the LGA is 17 per cent under a RCP 4.5 scenario. This accounts for a low probability of occurring but a high financial cost consequence of severe storm activity;

Note: for the purposes of this report, cyclone was not commented on.

Actions taken or proposed:

  • No actions have been taken or proposed for to address storm and cyclone risks within the LGA.

 Landslide

  • Landslide can be triggered by severe weather events (e.g. heavy rainfall) or human activities (vegetation removal, overgrazing, slope modification, etc.).38
  • The probability of landslides in the region are considered rare, but the level of consequence can be high depending on the location. This risk is higher in parts of the LGA with steep topography.

Actions taken or proposed:

  • No actions have been taken or proposed for to address landslide risks within the LGA.

 Heatwave

  • A heatwave is generally defined as ‘a period of abnormally hot weather lasting over several days’, and can be characterised as three or more days of high maximum and high minimum temperatures that are unusual for that location;’ 39
  • Towns and villages in the Yass Valley have already experienced water quality issues due to drought and heatwave conditions. Any increase in these will have flow on effects to water quality and availability for the Yass Valley.40

Actions taken or proposed :

  • No actions have been taken or proposed for to address heatwave risks within the LGA.

 Tsunami

  • Tsunami’s can be generated by a number of causes, however, undersea earthquakes are the most likely to generate such an event. Tsunami waves can run up beyond the high tide mark causing significant damage to coastal areas.

Actions taken or proposed:

  • No actions have been taken or proposed for to address storm and cyclone risks within the Council area.

 Earthquake

  • The State Disaster Mitigation Plan identifies Yass Valley Council as having the highest earthquake risk for the social environment (with Upper Lachlan Shire in second and Weddin Shire in third).
  • Based on the potential event probability, as provided by Risk Frontiers, annual average loss of residential, commercial and industrial buildings from flood in the LGA is 10 per cent under a RCP 4.5 scenario. This accounts for a low probability of occurring but a high financial cost consequence of earthquake activity; and
  • In 1886, an estimated magnitude 5.5 earthquake occurred near Yass (which was also reportedly felt in Queanbeyan) which caused damage to infrastructure in the township. 41

Actions taken or proposed:

  • No actions have been taken or proposed for to address storm and cyclone risks within the Council area.

Climate Change Data Summary

This section is based on climate modelling done by Risk Frontiers (2021) based on climate projections for Yass Valley Shire as displayed in Table 1 below. It focuses on a ‘medium’ emissions scenario, represented by RCP4.5.

Table 1: Snapshot of key changes in climate parameters modelled between 2010 to 2070 under RCP 4.5 medium emission scenario

The climate change data shows that the LGA is expected to experience hotter and drier conditions, with more fire danger days, increased drought, and more storms, but less annual and extreme rainfall. Cold conditions like frost expected to decrease.

Heatwave – measured by number of days with temperatures greater than 35°C

Heatwaves are a critical climate hazard affecting health, infrastructure, and ecosystems. Heatwave risk can be measured by tracking the number of days per year with maximum temperatures exceeding 35°C. This analysis, undertaken by Risk Frontiers in 2021, drew on 20-year averages from historical climate reanalysis data and future climate model projections under a ‘medium’ emissions scenario, represented by RCP4.5 (see Figure 1 below).

Figure 1: Frequency of days per year with temperature greater than 35 Celsius Degrees

(Values are 20-year averages for present day climate and change for future climate under the RCP4.5 scenario.)

The data highlights how the frequency and seasonality of high-temperature events are expected to shift over time in the LGA, informing the need for climate adaptation in infrastructure, health, and planning decisions.

Key Findings:

  • the frequency of hot days will increase for in the Yass Valley;
  • largest increases in heatwave and high temperature extremes will be seen during the summer months; and
  • high temperature extremes will also occur more frequently during spring and autumn.

Drought – measured by Keetch-Byram Drought Index, soil moisture and annual precipitation

Drought is a complex hazard influenced by temperature, rainfall, and how water is retained in the landscape. To assess how drought conditions are projected to change in the LGA, this analysis undertaken by Risk Frontiers in 2021 used three key climate indicators:

  • Keetch-Byram Drought Index (KBDI) – a widely used index that estimates how dry the landscape is based on temperature and rainfall. It also reflects the flammability of surface fuels and is commonly used for fire management (see Figure 2 below);
  • Soil moisture percentiles – a direct measure of how much water is retained in the soil compared to long-term conditions. Soil moisture is essential for agriculture, vegetation health, and ecosystem resilience (see Figure 3 below); and
  • Total annual precipitation – tracks overall rainfall trends, which are a key input for drought but must be considered alongside evaporation and temperature to understand drought risk fully (see Figure 4 below).

Figure 2: Annual mean Keetch-Byram Drought Index (KBDI) drought index value normalised on a scale of 0-10, where 10 is the maximum drought possible

(Values are 20-year averages for present day climate and change for future climate under the RCP4.5 scenario)

Figure 3: Annual mean soil moisture percentiles; values are calculated relative to present day climate, hence the 50% values for present day. Low values at 2070 are indicative of a drying landscape.

(Values are 20-year averages for present day climate and change for future climate under the RCP4.5 scenario)

Figure 4: Total annual precipitation in mm per year.

(Values are 20-year averages for present day climate and change for future climate under the RCP4.5 scenario)

These indicators are derived from climate model simulations using 20-year averages for present-day and future scenarios under RCP4.5. Together, they provide a fuller picture of both short-term and long-term drought potential, capturing the interplay between rainfall, heat, and water retention in the landscape.

Key Findings:

  • inland LGAs are more exposed and susceptible to drought compared to more coastal LGAs;
  • Under future climate, by 2070 the magnitude of drought will increase across all LGAs as seen in Figure 12 showing the projected changes in soil moisture percentiles. changes in total annual rainfall are less than the projected changes in soil moisture and drought, suggesting that the increase in drought is being driven primarily by increasing temperatures and their effect on evapotranspiration; and
  • By 2070 the magnitude of drought will increase across the Council area with the greatest impact occurring during the winter and spring.

Bush and grassfire – measured by the annual maximum Forest Fire Danger Index (FFDI)

Bushfires and grassfires are among the most dangerous and disruptive climate-related hazards in South-East NSW Region. The annual maximum Forest Fire Danger Index (FFDI) is the nationally recognised measure for assessing bushfire danger and is widely used by emergency services to guide fire warnings, restrictions, and preparedness. FFDI is a composite index that incorporates temperature, wind speed, humidity, and recent rainfall to estimate how dangerous fire weather is on a given day.

This analysis undertaken by Risk Frontiers in 2021 used 20-year averages from historical reanalysis data and future climate projections under the RCP4.5 scenario (see Figure 5 below). This indicator helps identify trends in both the severity and seasonal timing of fire weather across the LGA.

Figure 5: Magnitude of bushfire weather severity as represented by the annual maximum FFDI

(Values are 20-year averages for present day climate and change for future climate under the RCP4.5 scenario)

Key Findings:

  • the frequency of dangerous bushfire weather days and the magnitude of bushfire weather extremes will increase dramatically in Yass Valley and the surrounding LGAs by 2070; and
  • the largest changes for bushfire weather across southeast Australia are expected to be occurring during the spring, with a projected earlier onset of the bushfire season under a warmer climate.

Extreme rainfall and flooding – measured by daily precipitation over 30mm

Flooding poses a significant hazard to infrastructure, communities, and emergency services. This analysis uses the frequency of very heavy rainfall days (daily rainfall greater than 30mm) as an indicator of flood risk. This threshold (i.e., days with more than 30mm of rain often) is a recognised benchmark in climate and hydrological studies to identify rainfall events that can overwhelm stormwater systems, trigger flash flooding, and lead to significant overland flow.

Projections done by Risk Frontiers in 2021 compared 20-year averages for present day conditions with those for 2030 and 2070 under the RCP4.5 scenario (see Figure 6. below). This helps to understand how the intensity of rainfall events changes, which is crucial for flood management, infrastructure design, and emergency planning.

Figure 6: Frequency of very heavy rainfall days (>30mm)

(Values are 20-year averages for present day climate and change for future climate under the RCP4.5 scenario)

Key Findings:

  • under present day climate there are on average 4 very heavy rainfall days per year. This may change by 2070 with an expected warmer atmosphere modelled to increase high storm rainfall totals;
  • the primary driver of year-to-year variability in rainfall will continue to be the tropical climate drivers of Indian Ocean Dipole (IOD), El Niño Southern Oscillation (ENSO) and the Inter-decadal Pacific Oscillation (IPO). Projections for Pacific climate are indicating an increase in ENSO amplitude, meaning both El Niño and La Niña events will be stronger;
  • extreme rainfall events will produce higher rainfall totals due to the physical relationship between a warmer temperatures and higher atmospheric moisture capacity; and
  • higher rainfall totals may lead to higher flood levels during flooding events, but the frequency of these events will not differ significantly from present.

Severe storm, wind and hail – measured by East Coast Low (ECL) days and annual windspeed

Severe storms, ranging from East Coast Lows to thunderstorms and hail events, pose a recurring hazard to communities and infrastructure. This analysis uses two key indicators to evaluate storm-related risk under a changing climate:

  • frequency of East Coast Low (ECL) days – ECLs are among the most damaging storm systems affecting the region, often associated with extreme winds, heavy rainfall, large waves, and coastal erosion. Tracking their frequency is important for understanding long-term storm risks (see Figure 7 below); and
  • annual maximum windspeed – is used to assess the strength of storm systems and frontal weather events that can bring down trees, damage infrastructure, and increase fire danger (see Figure 8 below).

Figure 7: Frequency of east coast low days

(Values are 20-year averages for present day climate and change for future climate under the RCP4.5 scenario)

Figure 8 – Annual maximum windspeed (km/hr).

(Values are averaged across each LGA and calculated as 20-year averages for present day climate and change for future climate under the RCP4.5 scenario—windspeeds at individual locations and years will be significantly higher than the averages.)

These indicators help assess changes in both the occurrence and severity of damaging weather systems.

Projections done by Risk Frontiers in 2021 were based on 20-year averages comparing present-day conditions with future scenarios for 2050 and 2070 under RCP4.5. This helps identify trends in the intensity and potential impacts of storm systems in the LGA which may influence risk planning, emergency management, and infrastructure resilience.

Key Findings:

  • Under present day climate, the Council area is exposed to several types of storms, including east coast lows (ECL), extra-tropical lows, fronts, snowstorms, thunderstorms, and hailstorms
  • ECL are one of the most damaging storm types to impact the Council area. ECL frequency is expected to increase slightly under future climate which is consistent with an expectation of increased large scale interactions between warm and cool air masses as the climate warms
  • storms tend to be more frequent during La Niña events and less frequent during El Niño events. This relationship is not expected to change under a warming climate.
  • extratropical lows and associated fronts and thunderstorms can cause significant risk, especially during summertime when they are a primary cause of dangerous bushfire weather
  • maximum annual windspeed is projected to increase across the Council area, suggesting an increase in the strength of frontal systems.

NarCLIM 2.0 findings for Snowy Valleys Council

In 2022 NARCliM 2.0 climate data was publicly released – this is the most up-to-date regional climate modelling available for NSW and ACT and is used Government planning, assessments, and strategies.

Table 2 below describes the anticipated future climate projections specific to the Yass Valley Council based on NARCLiM 2.0 RCP4.5 SSP1-2.6 (low emissions) and SSP3-7.0 (high emissions) scenarios.

This information can also be viewed through an interactive climate change projection map via https://www.climatechange.environment.nsw.gov.au/projections-map

Table 2: NARCLiM 2.0 Emission Scenario projections – Yass Valley Council

Risk Exposure Summary

Hazards

A hazard is a natural process or occurrence, a source event which has the potential to result in harm or cause loss or damage depending on exposure. The South Eastern Regional Emergency Management Plan has identified the following hazards as having risk of causing loss of life, property, utilities, services and/or the community’s ability to function within its normal capacity:

  • fire (bush and grass)
  • snow
  • earthquake
  • flood (riverine)
  • flood (flash)
  • storm
  • heatwave
  • landslip; and
  • tsunami42

In 2024, the NSW State Disaster Mitigation Plan identifies these additional 3 hazards having the same risk to life and property:

  • Coastal hazard (erosion and inundation);
  • Storms and cyclones; and
  • Tsunami 43

Climate modelling helps us to examine the implications for hazard likelihood. The Climate modelling performed by Risk Frontiers as part of the Resilience Blueprint found that Yass Valley has:

  • low flood hazard risk with 3.93% of the land within a modelled floodplain. This is follows the Murrumbidgee River which drains into Lake Burrinjuck and continues to the south, the Yass River that flows across to the east and the Goodradigbee River to the south west (see Figure 9 below); and
  • moderate/medium bush and grassfire hazard risk with a modelled annual burning probability of 0.62%. This risk area is largely concentrated in the Brindabella National Park in the south and extends out to the vegetated areas to the south west (see Figure 10 below).

Figure 9: Yass Valley Flood Hazard Index

A dark blue indicates a flood plain, the lighter colour out of it.

The flood hazard index uses a map of modelled flood plains identified by several geographical/geospatial variables including different river types, river stream order, distance to river network, land cover, soil type, average slopes in known flood areas, relative changes in elevation near rivers, and river basin characteristics.

Figure 10: Yass Valley Bushfire Hazard Index

A darker red/orange indicates a higher average annual fire probability.

The fire hazard index is derived from modelling burned area data and other local environment and climate variables with local historical training data and adaptive data-driven learning methods. 

Life, Property, Economic and Environmental Loss Risk

Fatalities and life loss

 Figure 11: Yass Valley Fatalities from Natural Hazard

As shown in Figure 11 above, the risk that is posed to life is very difficult but a reality to of natural hazards. From a human health perspective, life loss throughout the region from 1900 to 30 June 2020 has been analysed using PerilAUS, Risk Frontiers’ database of natural hazard impacts. The analysis found that in Yass Valley, floods have resulted in the most fatalities – 14 fatalities, followed by bushfire (1 fatalities), and gust (1 fatality).

Despite the above, more lives have been lost as a result of the impacts of disaster events across the Yass Valley in the days, weeks, months and years that follow. The physical and mental health toll of events is enormous. It also does not capture cascading health issues and fatalities. Data in these regards is difficult to bring together but does not change the reality of the pervasive impact of disasters.

Impact on Property and Infrastructure

Figure 12: Distribution of the Average Annual Loss (AAL) of infrastructure by hazard for Yass Valley

In terms of the risks posed to property and infrastructure, Risk Frontiers’ Natural Catastrophe loss models have been used to estimate the financial cost, or Average Annual Loss (AAL) across four key hazards in the Council being bushfire, flood, hailstorm and earthquake. The models evaluated losses for commercial, residential and industrial properties.

Under current conditions, the overall baseline AAL for Yass Valley is approximately $2.8 million and the analysis found that flood is the most significant natural hazard accounting for 67% of the AAL, followed by hail (17%) and bushfire (10%) as shown in Figure 12 above).

Future climate projections indicate that the AAL in Yass Valley will be driven by fire and flood losses. Losses are projected to increase slightly by 13% for fire and 1% for flood by 2070 under a RCP 4.5 scenario.

Average Annual Loss identified in the State Disaster Mitigation Plan

The SDMP noted that Earthquake hazard in NSW is higher toward the south of the State around the ACT and near the Victoria border – particularly LGAs of Yass Valley, Upper Lachlan Shire and Queanbeyan-Palerang Region.

Yass Valley is identified as being the highest earthquake risk for the social environment (with Upper Lachlan Shire in second and Weddin Shire in third). This means that an earthquake would be particularly impactful in Eurobodalla, with impacts including:

  • Loss of life and injuries, generally due to building collapse;
  • Displacement from homes and communities due to building collapse or structural damage;
  • Mental health stress; and
  • Disruption to essential services such as food, water, energy, communications and supply chains.

The SDMP indicates that the AAL in Yass Valley Council for built environment in 2023 consisted of the following:

  • Coastal hazard (erosion and inundation) – Very Low;
  • Storms – Low;
  • Cyclones – Very Low; and
  • Tsunami – not recorded but noted as a rare event.

Editors note: the SDMP does not include specific AAL per LGA. It is colour coded on a scale from $0m to $112m.

Environmental Loss Risk

Risks to threatened flora, fauna and ecological communities from fire and flood were analysed using the following values:

  • threatened ecological communities
  • land use
  • land cover
  • protected areas
  • connectivity
  •  maximum above-ground biomass
  • fauna, flora and ecological communities
  • weed, pest and animal disease.

The fire and flood indices were overlaid with an exposure index locating threatened flora, fauna and ecosystems along with agricultural lands. The analysis found that there are:

  • Fauna exposure is medium. There are 22 different vulnerable animal species in the region, of which 12 are vulnerable, 5 are endangered, and 5 are critically endangered;
  • Flora exposure is medium. There are 15 different vulnerable plant species in the region, of which 6 are vulnerable, 6 are endangered and 3 are critically endangered;
  • Ecological community exposure is high. There are 4 different vulnerable ecological communities in the region, of which 2 are endangered and 2 are critically endangered.

The analysis also that the natural environment encompasses 22.89% of the region (6.77% of which is protected), 53.97% devoted to agriculture and farming and the remaining 23.14% is developed built environment.

The total maximum above ground biomass (indicating the potential vegetation density the LGA could support) is low with 2,377 tonnes of dry matter over the LGA. The overall environment exposure for Yass Valley’s environment has medium exposure as seen in Figure 13 below.

Figure 13: Yass Valley Overall Exposure Index

Agricultural Productivity

While there are no significant changes for rainfall, worsening drought conditions associated with warming temperatures will directly lead to lower overall soil moisture as seen in Table 1. A projected decrease in soil moisture from a warmer climate may impact beef and sheep productivity in Yass Valley. 

There is a correlation between agricultural productivity and climate parameters representing temperature and hydroclimate variability. Productivity for beef and sheep productivity tends to be higher during years that are wetter, cooler, retained soil moisture, and low risk of consecutive dry days. This correlation is particularly significant for sheep, but not as significant for beef however, there are there are sensitivities to hot days and drought conditions as shown in Figure 14 below.  

Figure 14: Correlation between Agricultural Operations and Climate Parameters in Yass Valley Council

Vulnerability and Capacity

Resilience is generally regarded as a function of the intersection of relative exposure, social vulnerability and community capacity:

  • Relative exposure is a function of hazard, describing the frequency and magnitude of natural hazard events and capturing the compounding effect of multiple hazards (fire and flood for this analysis);
  • Physical exposure of a community is determined such that the quantum of exposed people, buildings, essential facilities, industry, and agriculture can be evaluated;
  • Social vulnerability is determined by examining socio-economic and demographic factors that may exacerbate or ameliorate the effects of an external threat to a person’s life, livelihood, or assets; and
  • Community capacity to resist, avoid and / or adapt to a disaster and to use these abilities to create security either before or after a disaster can be determined by examining several factors.

For each of these measurement framework indicators, an index has been produced by a weighted average of each metric contributing to the category. An analysis of the measurement framework indicators for each Statistical Area 1 (SA1) across South East NSW culminates as an integrated index of resilience; Figure 15 and Figure 16 below shows community resilience indices for Yass Valley.

Figure 15: Yass Valley’s Resilience to Bush-Grass Fire Risk (Average)

Figure 16: Yass Valley’s Resilience to Flood Risk (High)

  • In Yass Valley:

    • The mean relative exposure component of the resilience index is average for bush/grass fire and high/extremely high average for flood. There were no SA1s scoring low to extremely low for either resilience to bush/grassfire or flood;
    • There are no SA1s scoring low to extremely low for the relative exposure component of resilience to either bush/grass fire or flood(see Figure 17 and Figure 18 below);
    • The Council area’s mean social vulnerability score is average. 8.7% of the population score low or worse for the social vulnerability component of resilience (see Figure 19 below); and
    • The mean community capacity component of the resilience index is average for bush/grass fire, and high for flood. There were no SAs scoring low to extremely low for the community capacity component of resilience to either bush/grass fire or flood (see Figure 20 and Figure 21 below).

Figure 17: Relative Exposure (Bush-Grass Fire)

Figure 18: Relative Exposure (Flood)

Figure 19: Social Vulnerability

Figure 20: Community Capacity (Bush-Grass Fire)

Figure 21: Community Capacity (Flood)

Gaps in Data

While the Goulburn Mulwaree Local Profile is underpinned by robust regional data and hazard modelling, several key data gaps remain that limit the precision of localised risk reduction planning:

Community preparedness and capacity indicators: No recent community survey data is available to assess awareness of hazard risks, levels of preparedness, or participation in local disaster response organisations. These are important indicators of community adaptive capacity.

Event-specific economic impact data: Although flood events (e.g., in 2020 and 2022) have caused substantial damage, detailed financial impact data on local businesses, insurance losses, and recovery timelines is lacking. This limits assessments of economic vulnerability and resilience.

Historical records for heatwave and storm impacts: While the region is known to experience high temperatures and storms, a centralised record of past events, including heatwave-related health impacts, asset damage from hailstorms, and infrastructure service disruptions, is not available.

Infrastructure interdependency analysis: There is insufficient analysis of how interdependent infrastructure systems (e.g., road access to healthcare, power to water treatment facilities) may amplify disaster impacts, particularly in rural townships and during cascading hazard events.

Monitoring and evaluation frameworks: The LGA currently lacks a resilience monitoring framework to track changes in exposure, vulnerability, and community capacity over time. This limits the ability to evaluate the success of DRR actions and adapt them over the long term.

Outdated flood planning documentation: Volume 2 of the Yass Valley Local Flood Plan was last updated in 2004. Although recent flood studies have been completed (e.g., Yass Floodplain Risk Management Report 2021), there is a need to integrate this data into updated operational emergency plans.

Hazard overlay integration into land use planning: While flood risk mapping exists for towns such as Murrumbateman and Yass, it is unclear to what extent these overlays have been incorporated into LEPs, DCPs, and strategic growth plans to prevent new development in exposed areas.

Reference

  1. .idconsulting, 2025, ‘Yass Valley Council area: About the profile areas’. Available online at https://profile.id.com.au/yass-valley/about
  1. Parkland Planners Pty Ltd and Optium Planning Groups, 2024, ‘Yass Valley Open Space Strategy 2024-2036’. Available online at https://www.yassvalley.nsw.gov.au/files/assets/public/v/1/our-council/policies-plans-and-reports/yass-valley-open-space-strategy-final-report-8-may-2024.pdf
  1. Ibid.
  1. Ibid.
  1. .idconsulting, 2025, ‘Yass Valley Council area: Population and dwellings’. Available online at https://profile.id.com.au/yass-valley/population
  1. Ibid.
  1. Ibid.
  1. .idconsulting, 2025, ‘Yass Valley Council area: Five year age groups’. Available online at https://profile.id.com.au/yass-valley/five-year-age-groups
  1. Ibid.
  1. .idconsulting, 2025, ‘Yass Valley Council area: Need for assistance’. Available online at https://profile.id.com.au/yass-valley/assistance
  1. .idconsulting, 2025, ‘Yass Valley Council area: Overseas arrivals’. Available online at https://profile.id.com.au/yass-valley/overseas-arrivals
  1. .idconsulting, 2025, ‘Yass Valley Council area: Language used at home’. Available online at https://profile.id.com.au/yass-valley/language
  1. Ibid.
  1. .idconsulting, 2025, ‘Yass Valley: Agriculture’. Available online at https://economy.id.com.au/yass-valley/value-of-agriculture
  1. .idconsulting, 2025, ‘Yass Valley: Worker productivity’. Available online at https://economy.id.com.au/yass-valley/worker-productivity-by-industry
  1. .idconsulting, 2025, ‘Yass Valley: Gross Regional Product’. Available online at https://economy.id.com.au/yass-valley/gross-regional-product
  1. Parkland Planners Pty Ltd and Optium Planning Groups, 2024, ‘Yass Valley Open Space Strategy 2024-2036’. Available online at https://www.yassvalley.nsw.gov.au/files/assets/public/v/1/our-council/policies-plans-and-reports/yass-valley-open-space-strategy-final-report-8-may-2024.pdf
  1. Yass Valley Council, 2025, ‘Natural Resource Management’. Available online at https://www.yassvalley.nsw.gov.au/Our-Services/Environment-Sustainability-Biosecurity/Natural-Resource-Management
  1. .idconsulting, 2025, ‘Yass Valley Council area: About the profile areas’. Available online at https://profile.id.com.au/yass-valley/about
  1. Parkland Planners Pty Ltd and Optium Planning Groups, 2024, ‘Yass Valley Open Space Strategy 2024-2036’. Available online at https://www.yassvalley.nsw.gov.au/files/assets/public/v/1/our-council/policies-plans-and-reports/yass-valley-open-space-strategy-final-report-8-may-2024.pdf
  1. Ibid.
  1. Ibid.
  1. Yass Valley Council, 2025, ‘Mayor and Councillors’. Available online at https://www.yassvalley.nsw.gov.au/Our-Council/About-Council/Mayor-and-Councillors
  1. Southern Tablelands Bush Fire Management Committee, 2018, ‘Bush Fire Risk Management Plan’. Available online at https://www.rfs.nsw.gov.au/__data/assets/pdf_file/0012/2631/Southern-Tablelands-BFRMP.PDF
  1. Yass Valley Council, 2020, ‘Local Strategic Planning Statement’. Available online at https://www.yassvalley.nsw.gov.au/files/assets/public/ipr-council-docs/strategies/adopted-yass-valley-lsps-27.5.2020.pdf
  1. Department of Regional NSW, 2023, ‘Southern Tablelands Regional Economic Development Strategy – 2023 Update’. Available online at https://www.yassvalley.nsw.gov.au/files/assets/public/v/1/ipr-council-docs/strategies/southern-tablelands-reds-2023-update.pdf
  1. Southern Tablelands Bush Fire Management Committee, 2018, ‘Bush Fire Risk Management Plan. Available online at https://www.rfs.nsw.gov.au/__data/assets/pdf_file/0012/2631/Southern-Tablelands-BFRMP.PDF
  1. NSW Rural Fire Services, 2013, Bush Fire Bulletin, Volume 35, No.1: ‘Speed and furt: The Cobbler Road grassfire’. Available online at https://issuu.com/nswrfs/docs/nsw_rfs_bush_fire_bulletin_single_page
  1. NSW SES, 2025, ‘Local Flood Insights: Murrumbidgee River’. Available online at https://storymaps.arcgis.com/stories/50dbc33dddcb444b9e3c526342cfc32d
  1. NSW SES, 2004, ‘Yass Valley Council Local Flood Plan, October 2004: Sub-Plan of the Yass Local Disaster Plan’. Available online at https://www.ses.nsw.gov.au/sites/default/files/2024-02/plan-yass-valley-lfp-june-2013-endorsed.pdf
  1. Yass Valley Council, 2020, ‘Local Strategic Planning Statement’. Available online at https://www.yassvalley.nsw.gov.au/files/assets/public/ipr-council-docs/strategies/adopted-yass-valley-lsps-27.5.2020.pdf
  1. NSW SES, 2004, ‘Yass Valley Council Local Flood Plan, October 2004: Sub-Plan of the Yass Local Disaster Plan’. Available online at https://www.ses.nsw.gov.au/sites/default/files/2024-02/plan-yass-valley-lfp-june-2013-endorsed.pdf
  1. Lyall & Associates Pty Ltd and Nexus Environmental Planning Pty Ltd. 2021, ‘Yass Flodplain Risk Management Study and Plan – Volume 1 Report’. Available online at https://www.yassvalley.nsw.gov.au/files/assets/public/v/1/our-services/planning-and-building/planning-and-building/yfrms-v1-report-rev-1.7.pdf
  1. NSW SES, 2004, ‘Yass Valley Council Local Flood Plan, October 2004: Sub-Plan of the Yass Local Disaster Plan’. Available online at https://www.ses.nsw.gov.au/sites/default/files/2024-02/plan-yass-valley-lfp-june-2013-endorsed.pdf
  1. About Regional, 2020, ‘Yass and Goulburn declared natural disaster zones after flooding’. Available online at https://aboutregional.com.au/yass-and-goulburn-declared-natural-disaster-zones-after-flooding/359020/
  1. About Regional, 2022, ‘$2.5m Yass Valley flood damage bill tipped to rise’. Available online at https://aboutregional.com.au/2-5m-yass-valley-flood-damage-bill-tipped-to-rise/
  1. Yass Valley Council, 2025, ‘Controls, Policies and Strategies’. Available online at https://www.yassvalley.nsw.gov.au/Our-Services/Planning-and-Building/Controls-Policies-and-Strategies
  1. NSW Reconstruction Authority, 2024, State Disaster Mitigation Plan 2024-2026. Available online https://www.nsw.gov.au/sites/default/files/noindex/2024-02/State_Disaster_Mitigation_Plan_Full_Version_0.pdf
  1. NSW Ambulance, 2024, State Heatwave Sub Plan. Available online at https://www.nsw.gov.au/rescue-and-emergency-management/sub-plans/heatwave
  1. Yass Valley Council, 2020, ‘Local Strategic Planning Statement’. Available online at https://www.yassvalley.nsw.gov.au/files/assets/public/ipr-council-docs/strategies/adopted-yass-valley-lsps-27.5.2020.pdf
  1. Marion Leiba (Geoscience Australia), 2007, Earthquakes in the Canberra Region. Available online at https://www.ga.gov.au/bigobj/GA11006.pdf
  1. South Eastern Regional Emergency Management Committee, 2021, South Eastern Emergency Management Plan (updated October 2023). Available online at https://www.nsw.gov.au/sites/default/files/noindex/2023-10/South_East_Region_EMPLAN_v2.1.pdf
  1. NSW Reconstruction Authority, 2024, State Disaster Mitigation Plan 2024-2026. Available online https://www.nsw.gov.au/sites/default/files/noindex/2024-02/State_Disaster_Mitigation_Plan_Full_Version_0.pdf