

The LGA is vulnerable to a wide range of natural hazards, making it essential to understand the nature and extent of exposure to people, buildings, infrastructure, services, or natural resources to effectively assess and address associated risks.
Exposure can be seen in various forms:
- Relative exposure is a function of hazard, describing the frequency and magnitude of natural hazard events and capturing the compounding effect of multiple hazards (fire and flood for this analysis). Where a community is subject to both fire and flood, it is potentially less resilient than one exposed to a single hazard of the same frequency and magnitude;
- The physical exposure of a community is determined such that the quantum of exposed people, buildings, essential facilities, industry, and agriculture can be evaluated. The physical vulnerability of exposed elements is also important, such as the age and construction type of buildings (for example, buildings with raised floors are more resilient to flood as they provide greater protection to the occupants and their belongings, resulting in less loss of life and property); and
- Social vulnerability is determined by examining socio-economic and demographic factors that may exacerbate or ameliorate the effects of an external threat to a person’s life, livelihood, or assets. Examples of these types of indicators include age, occupation, health status, income and education.
The Resilience Blueprint identified the following hazards as relevant hazardous events for the southeast NSW region. In 2024 the State Disaster Mitigation Plan (SDMP) was implemented and any additional hazards or information regarding exposure of hazard in the region has been included below:
 Fire (bush and grass)
- The majority of Goulburn Mulwaree with the exception of central urban areas is identified as bushfire prone land. 17
- Based on potential event probability, annual average loss of residential, commercial and industrial buildings due to bushfire is estimated at 6 per cent. This accounts for low probability but high-cost consequence of bushfire activity.
- Extended periods of heat and decreasing rainfall and drought has recently seen the extension of the bushfire period. 18
- The frequency of dangerous bushfire weather days and the magnitude of bushfire weather extremes will increase in the Council area. 19
- Reduced rainfall periods will exacerbate risk of bushfire and extend bushfire period. 20
- 2019-2020 Black Summer bushfires was the worst NSW has ever recorded. With 2,448 homes were destroyed and 5.5 million hectares (ha) of land was burnt. The impact on NSW communities, farmers, local businesses, wildlife and bushland was unprecedented. 21
- Grassfires can become common on hot days and heavy winds.
Actions taken or proposed
- Bushfire prone area mapping has been developed by council and is available through the Goulburn Mulwaree Disaster Dashboard or on Council’s website.
- Council will prepare a Bushfire Management Strategy as a part of the planning for urban growth.
- Council is committed to maintain up to date bushfire prone land mapping in order.
- The NSW Government has funded a new Bushfire Tanker after the 2019/202 Black Summer bushfires, to protect the communities within the states Southern Tablelands.22
 Snow
Snow
- Snowfall forecasts during winter months are increasing, however do not pose a risk to life and property.
- Goulburn Road normally one of the first roads to require closure, Goulburn Road is considered the main arterial road to Crookwell. A good indicator of snowfalls on this road is in vicinity of the Wind Turbines and the property known as “Lake Edward”.
- Severe snowfall events may cause snowfalls and black ice to form on higher and sheltered parts of these roads. This may disrupt normal traffic movements including commuters to and from Canberra and school bus services.
Actions taken or proposed
- State Emergency Service (SES) has implemented a South Eastern Region Snow Emergency Sub Plan with key strategies and actions, in conjunction with Council.
 Earthquake
- The LGA has a low earthquake exposure and has experienced minor earthquakes in the past.
- Based on potential event probability, annual average loss of residential, commercial and industrial buildings due to earthquakes is estimated at 15 per cent. This accounts for low probability but high-cost consequence of earthquake activity.
- In May 2024, a 3.9 magnitude earthquake hit 45km from Goulburn Mulwaree. Many residents within the LGA reported that they were impacted by violent shakes.23
Actions taken or proposed
- Due to low exposure within the LGA, no actions have been taken or proposed to address earthquake risk.
 Flood (riverine and flash)
- Sections of the City of Goulburn are highly susceptible to damage and disruption from floodwaters from both the Wollondilly River and Mulwaree Chain of Ponds.24
- Based on potential event probability, annual average loss of residential, commercial and industrial buildings due to flood is estimated at 43 per cent. This accounts for low probability but high-cost consequence of flood activity.
- Historic major flood events, known to have caused flooding of properties in Goulburn, have occurred in April 1870, July 1900, June 1925, June 1950, October 1959, November 1961 and August 1974.25
- The 1961 flood event is reported to be the highest flood in recorded history on the Wollondilly River at Goulburn.26
- More recently, significant flooding in Goulburn has occurred in August 1990, December 2010, March 2012 and June 2012.27
- In 2022, Goulburn experienced extreme overland flow flooding, with the Goulburn River system peaking at one hundred and ninety times the base-flow level.28
Actions taken or proposed
- Flood prone area mapping has been developed by council and is available through the Goulburn Mulwaree Disaster Dashboard or on Council’s website.
- Goulburn Mulwaree Council and the NSW State Emergency Service (SES) have collaborated to undertake the following projects:
- Marulan Flood Study – Hydraulic and hydrologic models – complete
- Goulburn Floodplain Risk Management Study and Plan – complete
- Wollondilly and Mulwaree Rivers Flood Study – complete
- A Review of Flooding in Goulburn – complete
- Goulburn – Flood Inundation Map – complete
- Marulan Flood Study – draft.29
- Council is committed to maintain an updated Floodplain Risk Management Study and Plan for Goulburn city.
- NSW State Emergency Service (SES) prepared a Goulburn Mulwaree local flood and emergency sub plan.
- Council is currently engaged to undertake a Flood Risk Management Study that focuses on overland flow.
- Council intends to update planning provisions for flooding both within identified flood study areas and generic provisions for areas without flood studies
- Council intends to prepare a flood model for the LGA to assist and inform planning outside the urban areas.
- Council intends to identify shortfalls in infrastructure for urban drainage where affected by localised flooding.
 Storm and cyclone
- Severe storms in NSW are often associated with East Coast Lows (ECL). ECL events are extreme weather systems that occur in South-East Australia, bringing extreme winds, rain, waves and elevated coastal water levels.
- Based on potential event probability, annual average loss of residential, commercial and industrial buildings due to hail is estimated at 36 per cent. This accounts for low probability but high-cost consequence of hail activity.
Note: for the purposes of this report, cyclone was not commented on.
Actions taken or proposed
- No actions have been taken or proposed for to address storm and cyclone risks within the Council area.
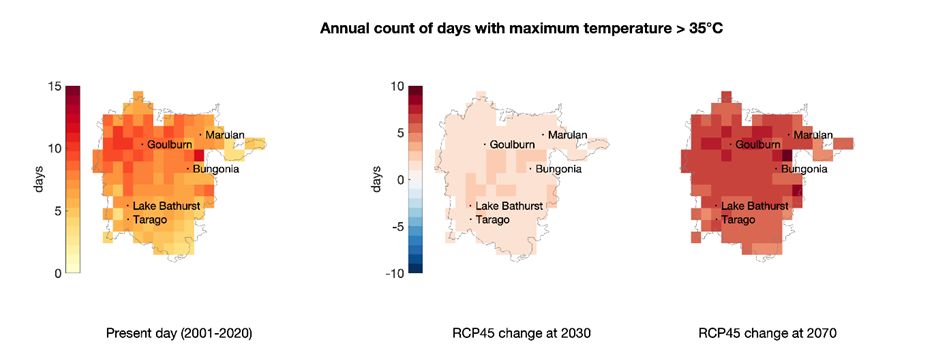
 Heatwave
- Acute extreme temperatures can lead to health risks, particularly of aging populations, as well as higher energy costs for associated cooling. Such events can rapidly exacerbate existing drought conditions by rapidly reducing remaining surface and soil water/moisture.30
- The shocks of heatwave are typically indirect and are associated with joint probabilities of other hazards (bushfire, drought, and flood). 31
Actions taken or proposed
- Implementation of Regional Drought Resilience plan in January 2025.
 Landslide
- The exposure in Goulburn Mulwaree is low.
- Landslide can be triggered by severe weather events (e.g. heavy rainfall) or human activities (vegetation removal, overgrazing, slope modification, etc.).
- Landslides can be caused by a major event such as earthquake, but in NSW, landslides are generally caused when heavy rain saturates soil on a hillside past the point where vegetation can support the soil’s weight against the force of gravity. The top saturated layer of soil then slips down the hill, taking whatever is on the land with it.
Actions taken or proposed
- Landslide Get Ready, deliver by the Queensland Reconstruction Authority has been referenced as a guide on the Goulburn Mulwaree Council Disaster Dashboard.
 Tsunami
- Tsunami’s can be generated by a number of causes, however, undersea earthquakes are the most likely to generate such an event. Tsunami waves can run up beyond the high tide mark causing significant damage to coastal areas.32
Actions taken or proposed
- No actions have been taken or proposed for to address storm and cyclone risks within the Council area.


Heatwave – measured by number of days with temperatures greater than 35°C

Drought – measured by Leetch-Byram measured by Keetch-Byram Drought Index, soil moisture and annual precipitation


Bush and grassfire – measured by the annual maximum Forest Fire Danger Index (FFDI)

Extreme rainfall and flooding – measured by daily precipitation over 30mm

Severe storm, wind and hail – measured by East Coast Low (ECL) days and annual windspeed