
The LGA is vulnerable to a wide range of natural hazards, making it essential to understand the nature and extent of exposure to people, buildings, infrastructure, services, or natural resources to effectively assess and address associated risks.
Exposure can be seen in various forms:
- Relative exposure is a function of hazard, describing the frequency and magnitude of natural hazard events and capturing the compounding effect of multiple hazards (fire and flood for this analysis). Where a community is subject to both fire and flood, it is potentially less resilient than one exposed to a single hazard of the same frequency and magnitude;
- The physical exposure of a community is determined such that the quantum of exposed people, buildings, essential facilities, industry, and agriculture can be evaluated. The physical vulnerability of exposed elements is also important, such as the age and construction type of buildings (for example, buildings with raised floors are more resilient to flood as they provide greater protection to the occupants and their belongings, resulting in less loss of life and property); and
- Social vulnerability is determined by examining socio-economic and demographic factors that may exacerbate or ameliorate the effects of an external threat to a person’s life, livelihood, or assets. Examples of these types of indicators include age, occupation, health status, income and education.
The Resilience Blueprint identified the following hazards as relevant hazardous events for the southeast NSW region. In 2024 the State Disaster Mitigation Plan (SDMP) was implemented and any additional hazards or information regarding exposure of hazard in the region has been included below:
 Flooding
- Wagga Wagga has a history of flood events with 77 floods recorded since the early 1840s.23
- There have been years of frequent floods, i.e. in one year 1974 Wagga Wagga had five floods all over 8.92 m and there was severe flooding in the 1950 to 1956 period.24
- 2022 and 2012 flooding events forces residents to evacuate Wagga Wagga with flood waters reaching above 8 metres
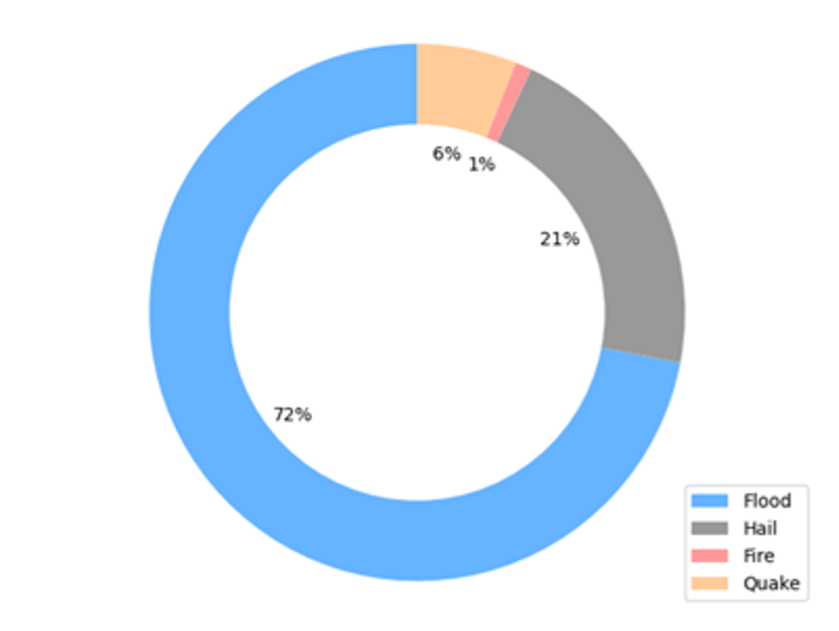
- Based on potential event probability, annual average loss of residential, commercial and industrial buildings due to flooding is estimated at 72 per cent. This accounts for high probability and high-cost consequence of earthquake activity.
- Overland flow flood behaviour typically occurs as when the capacity, of the local drainage and the smaller creek systems flowing into the Murrumbidgee, is exceeded.25
- 1962 properties impacted by flooding over floor and 12,934 properties impacted externally across the Study Area. The annual average damages for residential and commercial/industrial properties was found to be $16.09M. This represents the average cost of flooding each year.26
- In historic flood events, entire homes have been inundated by flood waters, and in others the flood waters will reach 1.5m through the homes. Many people assume each flood will be like the last, however, this is not usually the case. 27
Actions taken:
- Council consulted with WMA Water to develop the Wagga Wagga Major Overland Flow Floodplain Risk Management Study and Plan which provides a suite of recommendations for mitigation and adaptation.
- Council has undertaken 6 flood management studies in collaboration with external consultants. These include:
- Uranquinty Levee feasibility and Design
- Glenfield Drain Flood Mitigation Options
- Lake Albert Flood Mitigation Options
- North Wagga Flood Mitigation Options
- Humula and Mangoplah Flood Studies
- Levee Pump Augmentation Scheme
- Council has also undertaken floodplain risk management studies and plans for the villages of Tarcutta, Landysmith and Uranquinty.
- Council is committed to ongoing monitoring and review of flooding through flood risk management planning for both riverine and overland flow flooding.28
 Severe storm
- Severe thunderstorms are the most common and most damaging types of storms in NSW. These storms have a short life span and only affect areas a few kilometres across. Although severe thunderstorms can occur at any time, there is a marked tendency for thunderstorms and severe thunderstorms to occur during months from October through to March. 29
- In January 2025, Wagga Wagga was struck with a severe storm that left several people injured, treed uprooted and fallen over and a wide-scale power outage.30
- The January 2025 thunderstorm brought heavy rainfall and strong winds that resulted in the bringing down trees and tree limbs, which damaged buildings, vehicles and some infrastructure in suburban and rural areas across the Wagga Wagga LGA. It was noted as the “one of the biggest clean-up efforts we’ve had to organise in years in terms of the amount of trees and branches brought down and how widespread the damage was in our LGA”. 31
- Based on potential event probability, annual average loss of residential, commercial and industrial buildings due to hail is estimated at 21 per cent. This accounts for low probability but high cost consequence of earthquake activity.
Actions taken:
- NSW Government released an extended disaster recovery support grant.
- In 2018, the NSW Government released a NSW State Storm Plan, a Sub Plan of the State Emergency Management Plan (EMPLAN)
- Council consulted with WMA Water to develop the Wagga Wagga Major Overland Flow Floodplain Risk Management Study and Plan which provides a few of recommendations for mitigation and adaptation to storm events.
 Bushfire and grassfire
- The frequency of dangerous bushfire weather days and the magnitude of bushfire weather extremes will increase particularly in Wagga Wagga which is already experiencing such days.
- The largest changes for bushfire weather across southeast Australia are expected to be occurring during the spring, with a projected earlier onset of the bushfire season under a warmer climate.
- In September of 2024, the Wagga Wagga LGA was urged to prepare for the upcoming bushfire season due to warmer weather conditions and prolific vegetation growth after consecutive wet years increasing the fire risk. 32
Actions taken:
- Council is committed to reviewing and updating bushfire hazard mapping with the Rural Fire Service to ensure our planning reflects the most up to date risks associated with bushfire events. Future development must respond and plan to minimise bushfire risks to property and people.33
 Heatwave
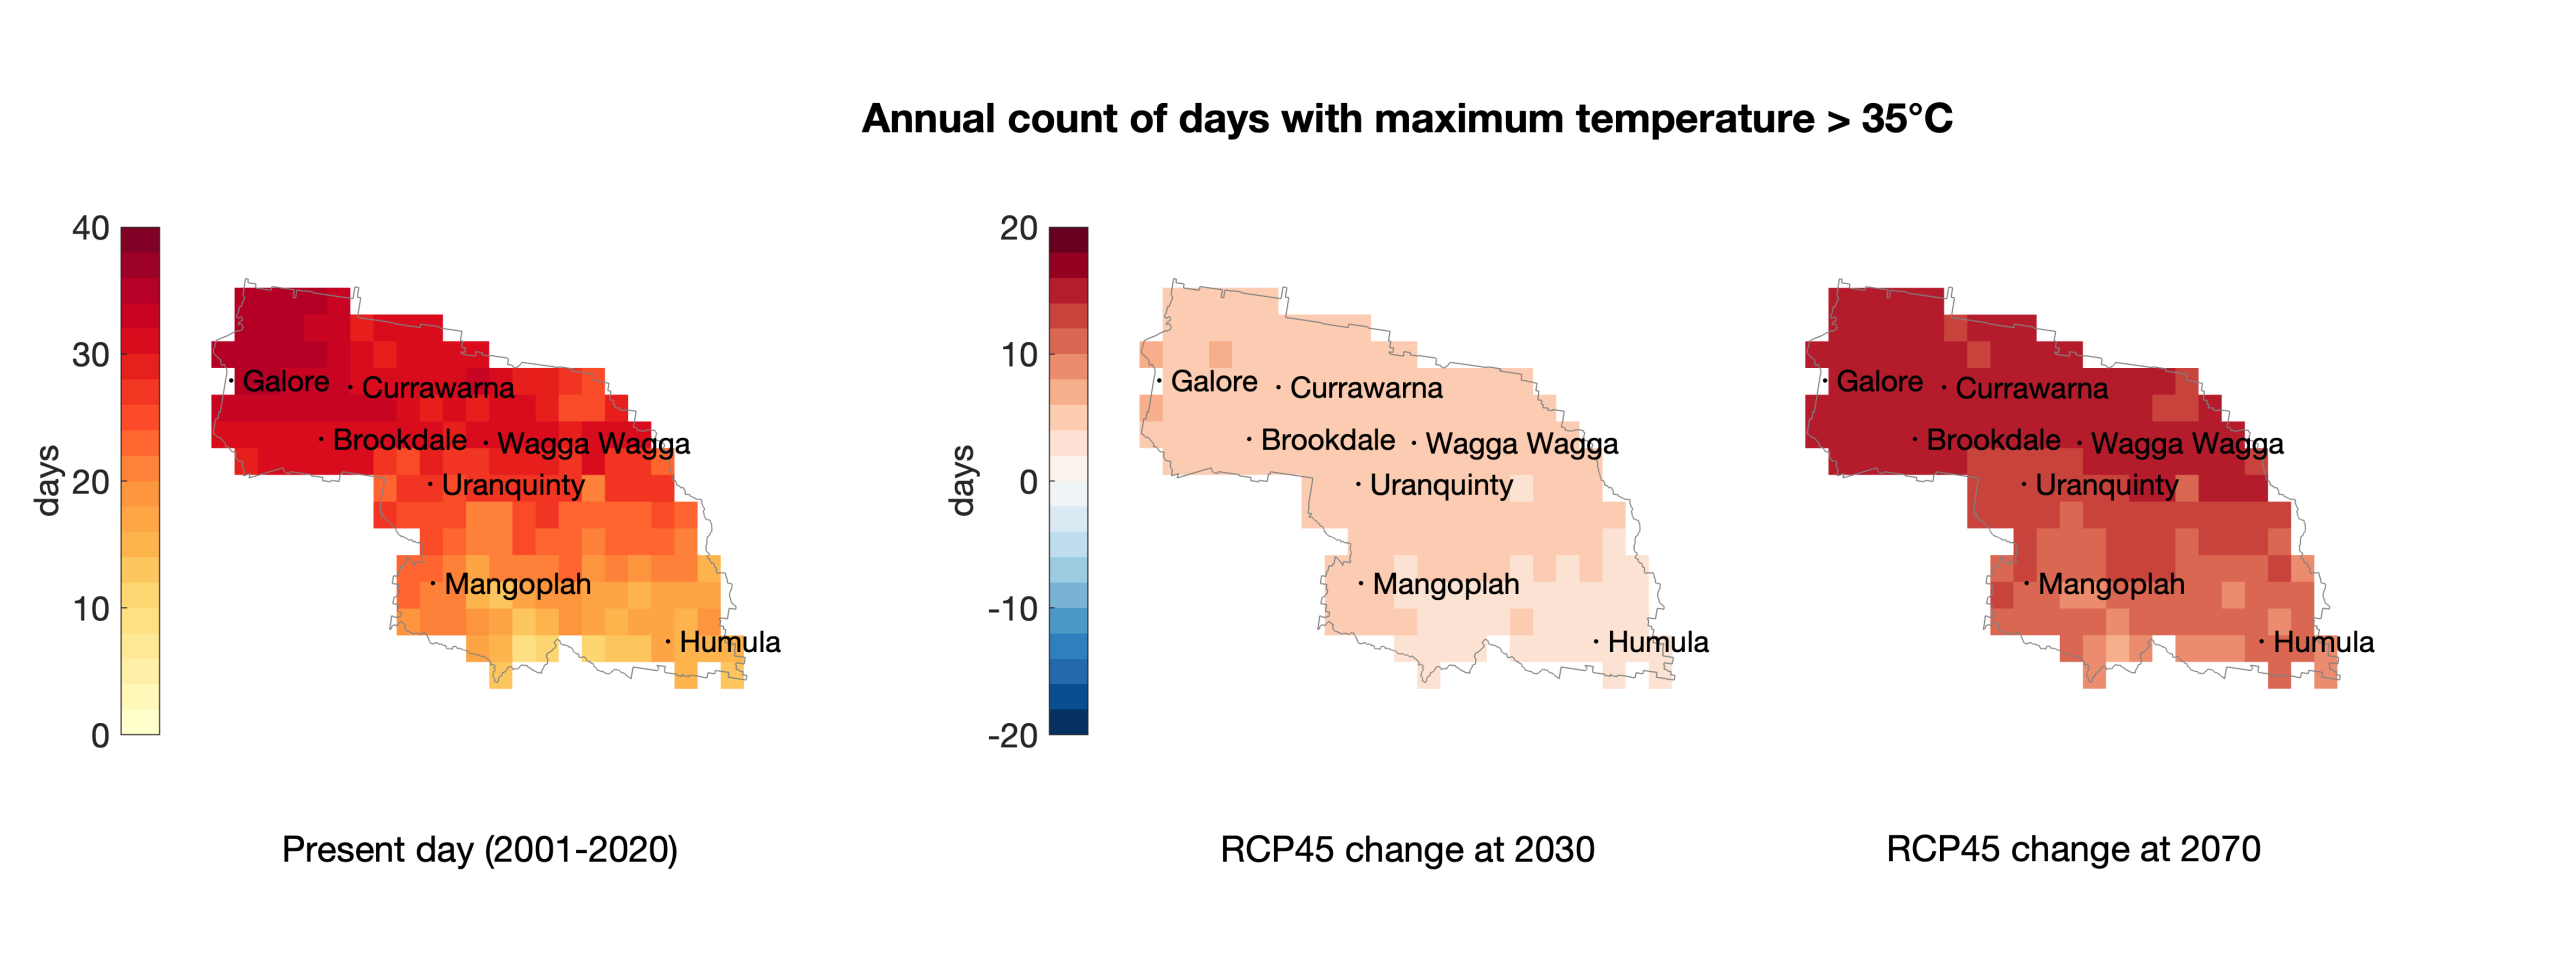
- The magnitude of temperature extremes and frequency of hot days will increase for inland LGAs, particularly for Wagga Wagga.
- Largest increases in heatwave and high temperature extremes will be seen during the summer months.
- High temperature extremes will also occur more frequently during spring and autumn.
- In November of 2024, major power stations left the LGA without power amidst a heatwave, with temperatures reaching up to 39 degrees Celsius. 34
- In December of 2024, a heatwave stretched through the Wagga Wagga LGA and temperature rose up to 15 degrees Celsius above the annual average. The maximum temperature reached was 42 degrees Celsius. 35
Actions taken:
- Council have developed a Heatwave Response Plan Checklist.


Heatwave – measured by number of days with temperatures greater than 35°C

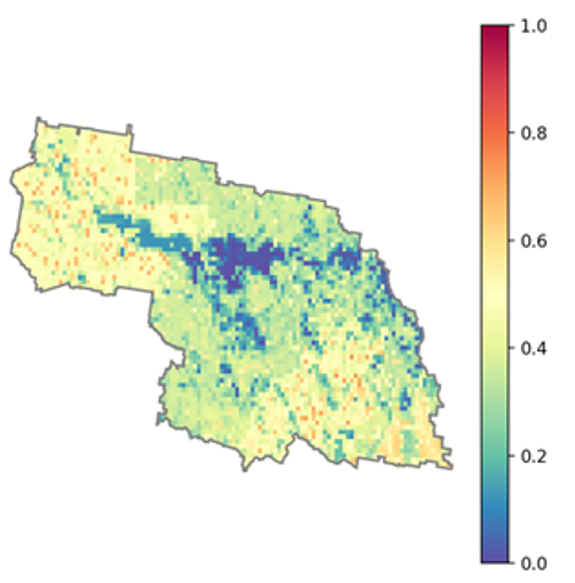
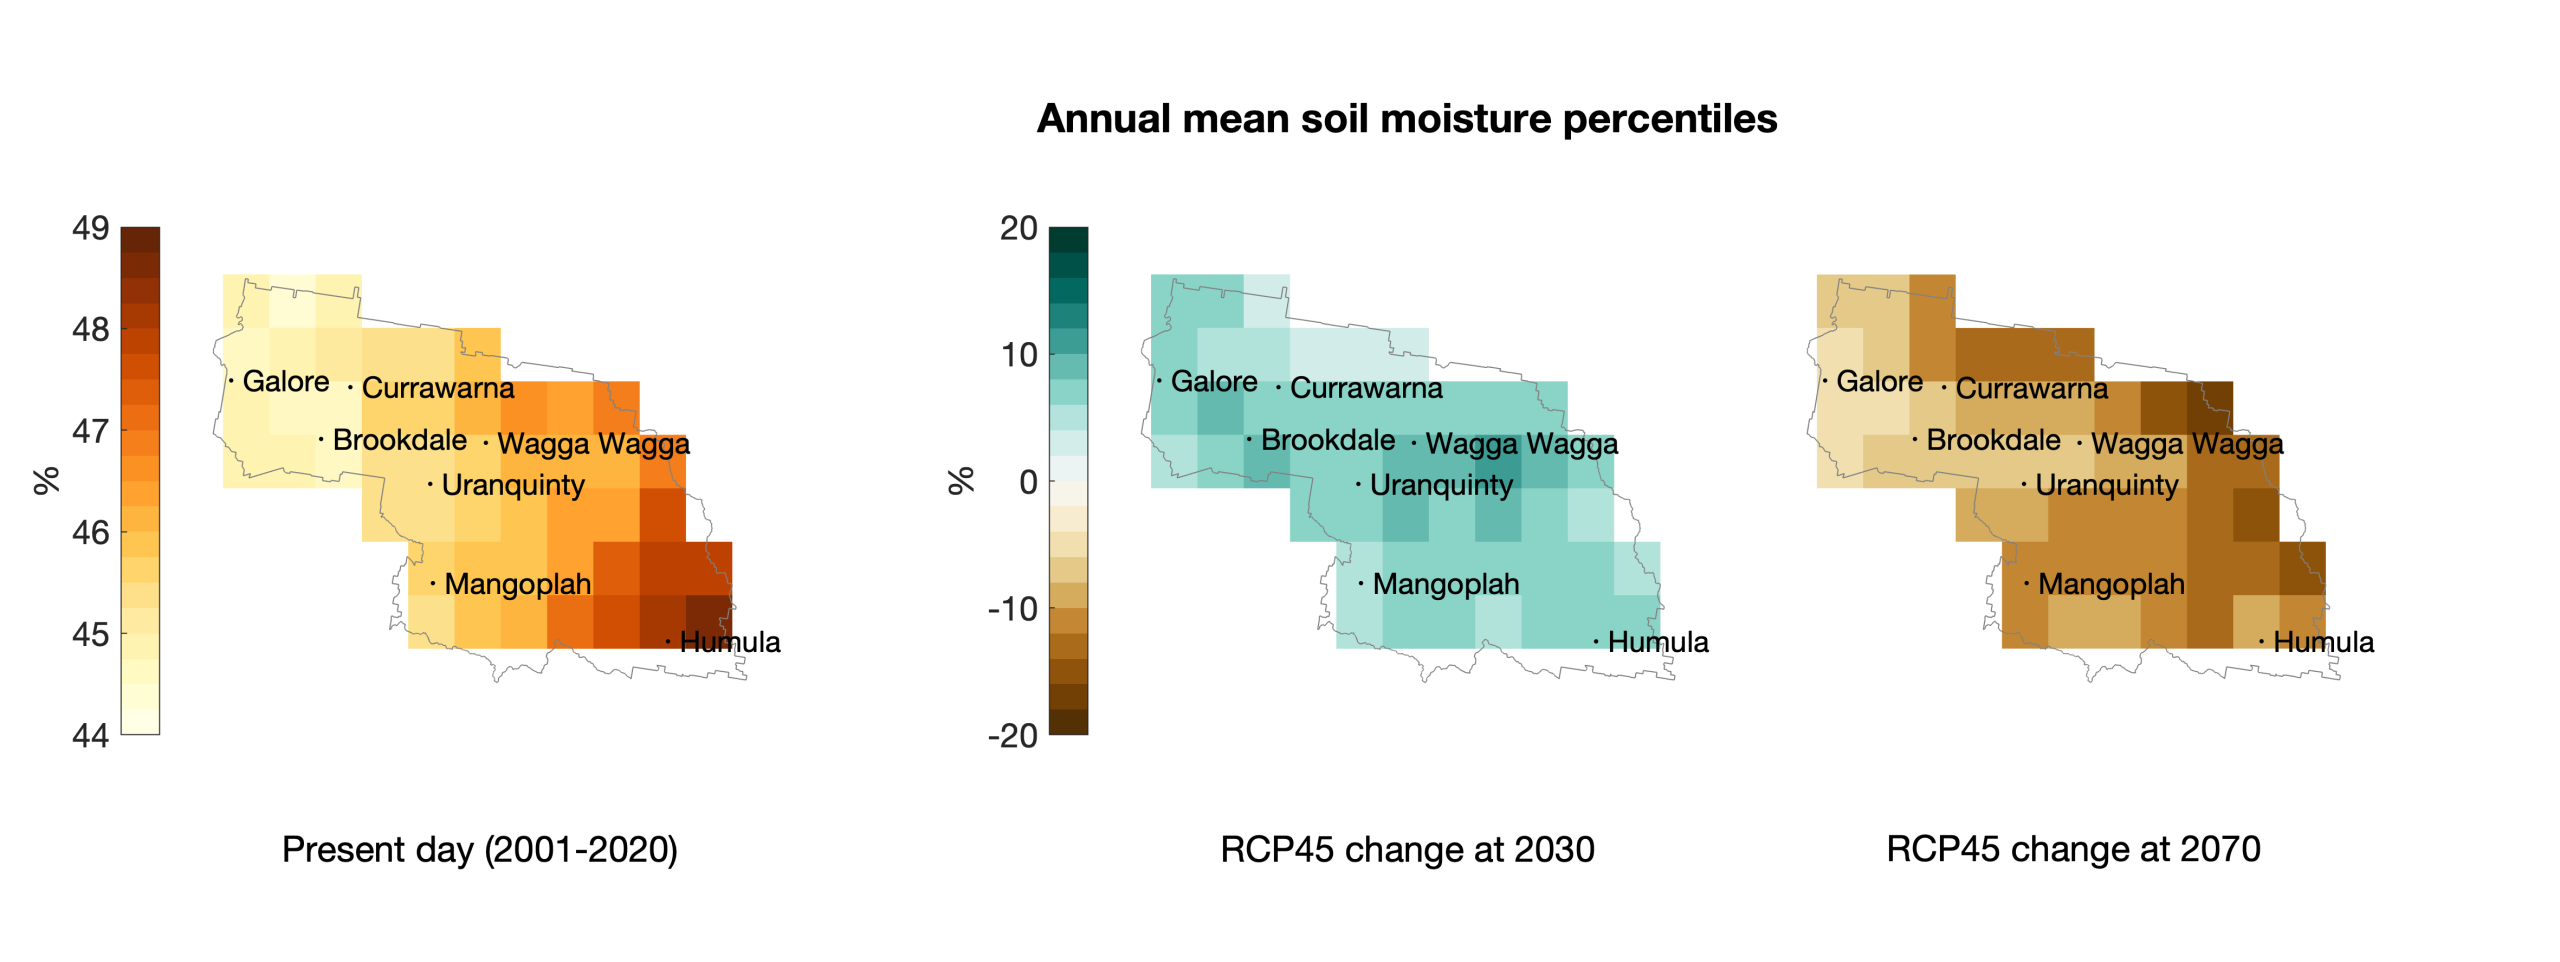
Drought – measured by Leetch-Byram Drought Index, soil moisture and annual precipitation


Bush and grassfire – measured by the annual maximum Forest Fire Danger Index (FFDI)


Extreme rainfall and flooding – measured by daily precipitation over 30mm

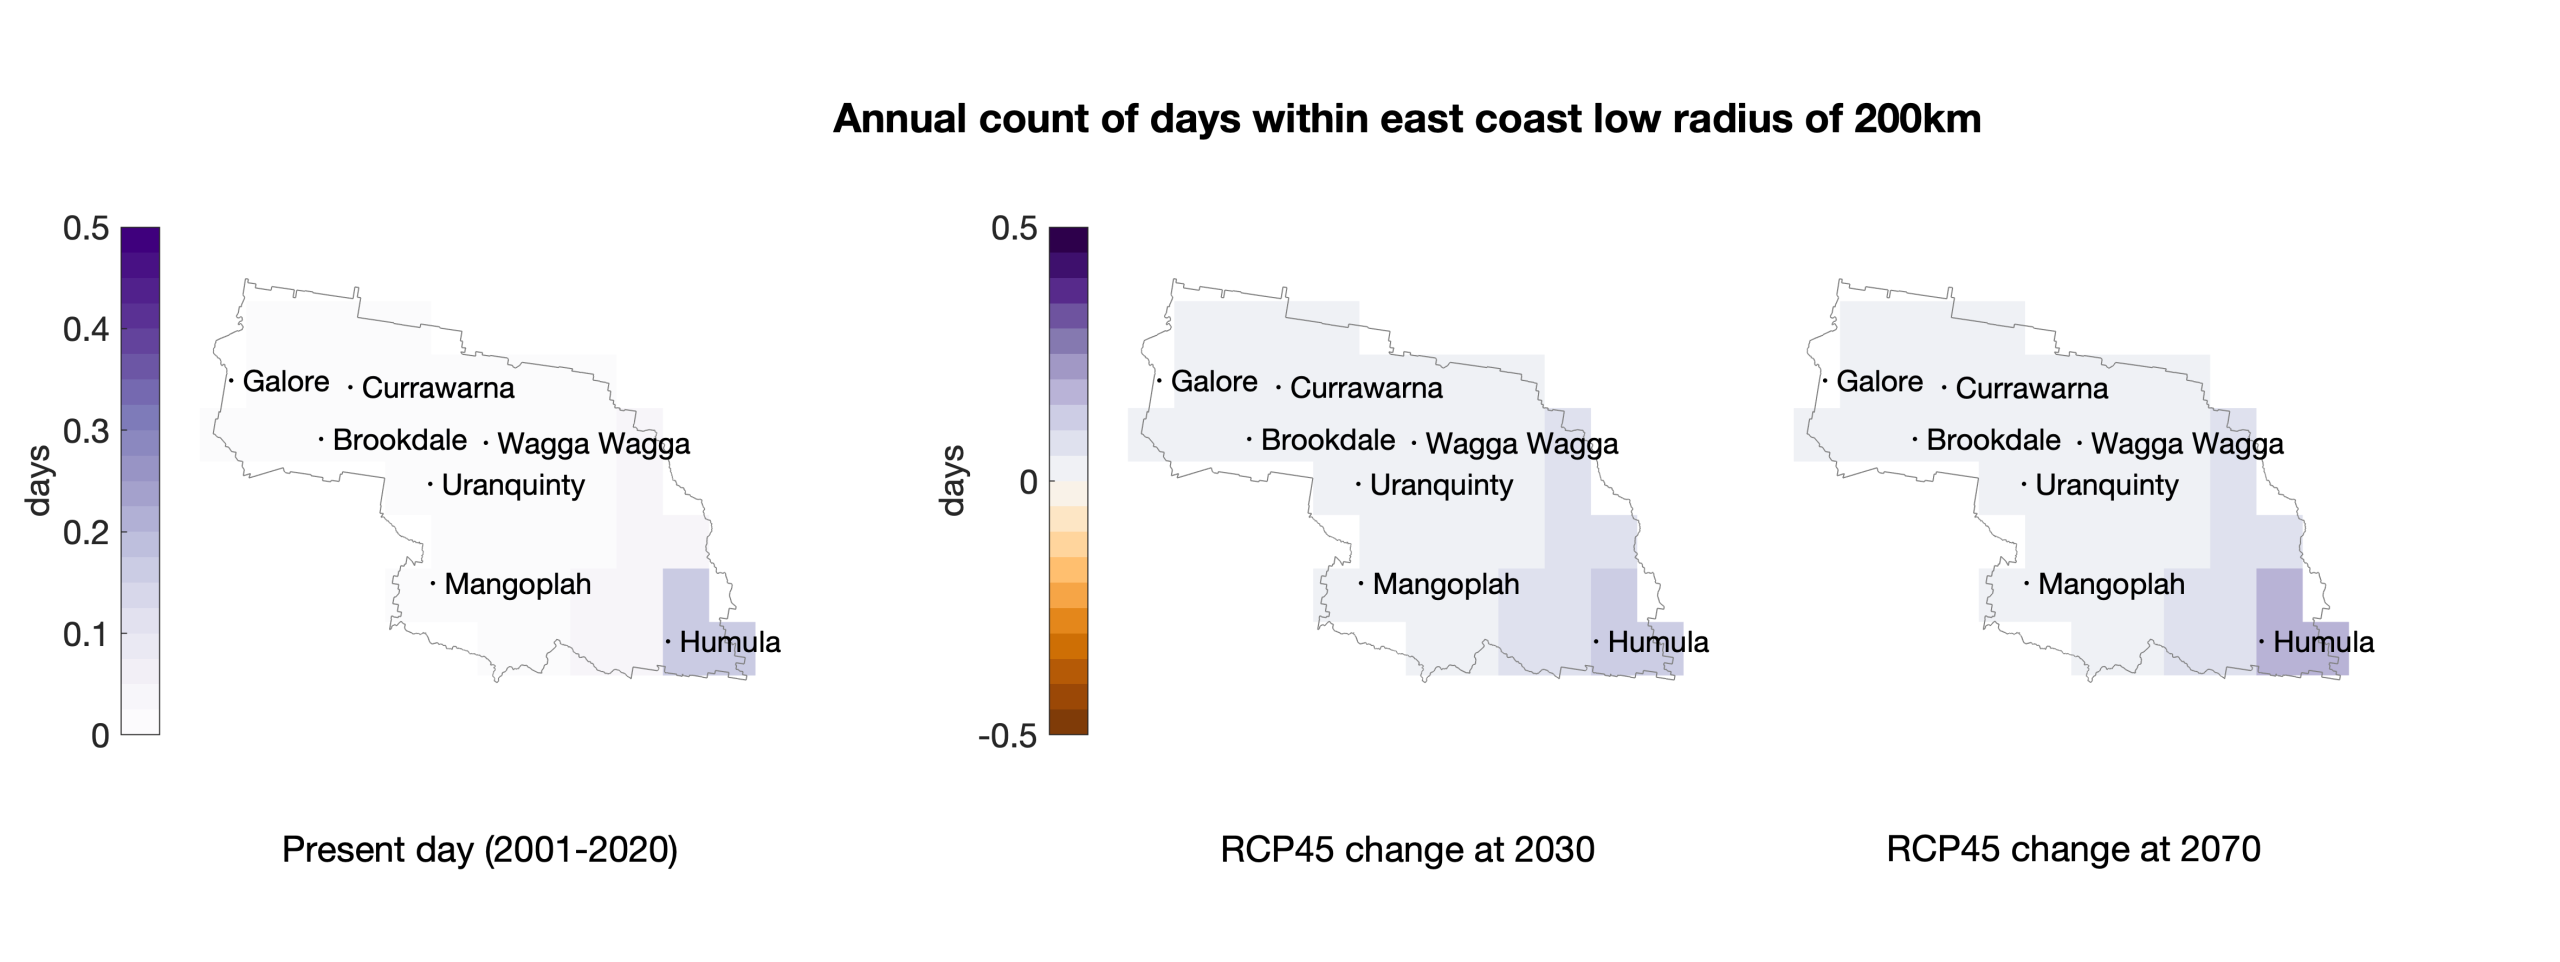
Severe storm, wind and hail – measured by East Coast Low (ECL) days and annual windspeed