
The LGA is vulnerable to a wide range of natural hazards, making it essential to understand the nature and extent of exposure to people, buildings, infrastructure, services, or natural resources to effectively assess and address associated risks.
Exposure can be seen in various forms:
- Relative exposure is a function of hazard, describing the frequency and magnitude of natural hazard events and capturing the compounding effect of multiple hazards (fire and flood for this analysis). Where a community is subject to both fire and flood, it is potentially less resilient than one exposed to a single hazard of the same frequency and magnitude;
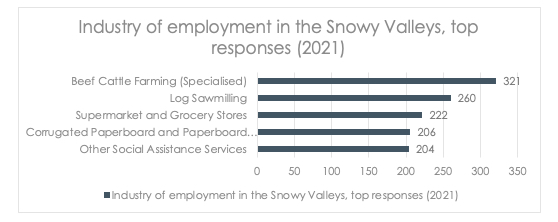
- The physical exposure of a community is determined such that the quantum of exposed people, buildings, essential facilities, industry, and agriculture can be evaluated. The physical vulnerability of exposed elements is also important, such as the age and construction type of buildings (for example, buildings with raised floors are more resilient to flood as they provide greater protection to the occupants and their belongings, resulting in less loss of life and property); and
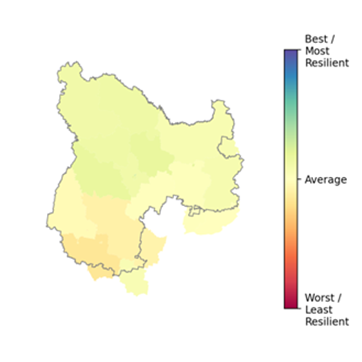
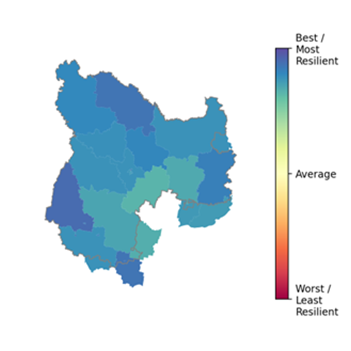
- Social vulnerability is determined by examining socio-economic and demographic factors that may exacerbate or ameliorate the effects of an external threat to a person’s life, livelihood, or assets. Examples of these types of indicators include age, occupation, health status, income and education.
The Resilience Blueprint identified the following hazards as relevant hazardous events for the southeast NSW region. In 2024 the State Disaster Mitigation Plan (SDMP) was implemented and any additional hazards or information regarding exposure of hazard in the region has been included below:
 Bushfire and grassfire
- The Southern Tablelands Region (which includes the Upper Lachlan, Yass Valley & Goulburn Mulwaree LGAs) has on average 265 bush fires per year, of which 5 could be considered to be large fires. It is noted that rainfall is both unreliable in the region, and generally at its lowest during the summer months. This is known to result in dry pastures over a large proportion of the shire, increasing grassfire risk. 25
- A number of large fires have also occurred within the Shire in recent years, including:
- The Wombeyan Caves fire in 2019/20 which resulting in significant damage to the land surrounding the caves causing their shut down; 26
- A series of bushfires impact Upper Lachlan In February 2023 27 and March 2023 (Curraweela Bushfire). 28
- Largest changes for bushfire weather in the Shire is expected to be during spring, with a projected earlier onset of bushfire season under a warmer climate;
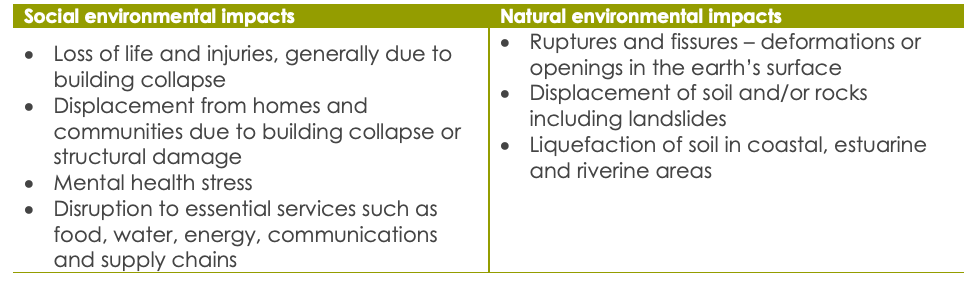
- Bushfire have the potential to generate significant damage to and loss of infrastructure, and loss of life, and major impacts on ecosystems; and
- Based on potential event probability as provided by Risk Frontiers in 2021, annual average loss of residential, commercial and industrial buildings due to bushfire is estimated at 3 per cent under a RCP 4.5 scenario. This accounts for low probability but high-cost consequence of bushfire activity.
Actions taken or proposed:
- Following the March 2023 Curraweela Bushfire, Council has engaged with landowners and state agencies to work to allocating $640,000 of funding for the removal of damaged trees within the public road reserve, with restrictions preventing its use for addressing hazards on private properties. 29
- The Southern Tablelands Bush Fire Management Committee is updating the Bush Fire Risk Management Plan for Southern Tablelands. It identifies the bush fire risks in Upper Lachlan, Yass Valley & Goulburn Mulwaree LGAs and sets out the types of work scheduled to deal with the risk of bush fires.
 Flooding
- Significant flood events have occurred in the Upper Lachlan Shire including in December 2010 and March 2012. The December 2010 storm was the more severe of the two events at the four villages. The heaviest rainfall occurred over the raindays of 9 and 10 December, preceded by heavy falls at the end of November. The catchments would therefore have been rather wet and losses due to infiltration quite small;
- The Upper Lachlan is a local government area (LGA) within the Lachlan River and Hawkesbury – Nepean catchments. Within this LGA, there are 3,250 residential dwellings and a population of 8,710. It is estimated that 11.5% of the population, or 1,000 people in Upper Lachlan are at risk of flooding; 30
- Flash flooding is known to impact several of the major villages in the Shire, including: 31
- At Crookwell, 103 residential properties would be flood affected;
- At Gunning, 34 residential properties would be flood affected at the 100 year ARI level of flooding. Seven of those properties would experience above-floor inundation up to 200 mm, while eight commercial properties and three public buildings would be flooded above floor level in the event of a 100 year ARI flood;
- At Collector, four residential properties would be flood affected at the 100 year ARI level of flooding, of which none would experience above-floor inundation; and
- At Taralga, 14 residential properties would be flood affected, of which two would experience above-floor inundation up to 200 mm in the event of a 100 year ARI flood.
- Based on potential event probability as provided by the Risk Frontiers, annual average loss of residential, commercial and industrial buildings due to flood is estimated at 10 per cent under a RCP 4.5 scenario. This accounts for low probability but high-cost consequence of flood activity.
Actions taken or proposed:
- Council has undertaken the Villages of Crookwell, Gunning, Collector and Taralga Floodplain Risk Management Study and Draft Plan (prepared by Lyall & Associates and Nexus Environmental Planning Pty Ltd.) to better understand current and future anticipated flood behaviour32.
- In 2021, the NSW Government prepared the Upper Lachlan Shire Total Flood Warning System: Investigation and Options Report. The recommended option involves the installation of additional rainfall and monitoring infrastructure in three of the four catchments and at Gunning33. This is currently being implemented.
 Severe storm
- Severe thunderstorms are the most common and most damaging types of storms in NSW. These storms have a short life span and only affect areas a few kilometres across. Although severe thunderstorms can occur at any time, there is a marked tendency for thunderstorms and severe thunderstorms to occur during months from October through to March. 34
- Severe storms are known to occur in the Shire. In October 2022, a severe storm significantly impacted Gunning, resulting in subsequent flooding which inundated 14 premises. 35
- East coast lows (most damaging storm type to impact the LGA) is expected to increase in frequency
- Extratropical lows and associated fronts and thunderstorms can cause significant risk, especially during summertime as they are a primary cause of dangerous bushfire weather
- Maximum annual windspeed is projected to increase across the Shire
- Based on potential event probability as provided by Risk Frontiers, annual average loss of residential, commercial and industrial buildings due to hail is estimated at 59 per cent (moderate to high probability with a high cost) under a RCP 4.5 scenario.
- Note: for the purposes of this report, cyclone was not commented on.
Actions taken or proposed:
- No actions have been taken or proposed to address severe storms by Council.
Note: for the purposes of this report, cyclone was not commented on.
Snow
- Snow events can affect different parts of the LGA. In July 2015, a significant snow event resulted in multiple road closures and damage to buildings. This disrupted the Crookwell township for up to a week. 36 The storm also caused a power outage in Grabban Gully, nearby Crookwell. 37
- Priority roads identified to be patrolled as a priority include: 38
- Goulburn Road, which is considered the main arterial road for the region. This section of the road can become susceptible to icy surfaces (black ice);
- Binda Road, near the locality of “Wade’s Hill”;
- Peelwood Road;
- Laggan / Taralga Road;
- Grabben Gullen Road (which can receive significant snow coverage);
- Boorowa Road;
- Abercrombie Road (between Oberon and Taralga); and
- Taralga Road (between Taralga and Goulburn).
Actions taken or proposed:
- The State Emergency Service (SES) has implemented a South Eastern Region Snow Emergency Sub Plan with key strategies and actions in conjunction with Council.
 Landslide
- Landslide can be triggered by severe weather events (e.g. heavy rainfall) or human activities (vegetation removal, overgrazing, slope modification, etc.). 39
- Following the fires around the Wombeyan Caves area in early-2020, a serious storm and rainfall event occurred. The fires had previously destroyed the vegetation impacted the soil integrity. The rainfall resulted in a series of approximately 15 major rockfalls along a 14km section of the Wombeyan Caves Road. 40
Actions taken or proposed:
- No actions have been taken or proposed to address landslide risks by Council.
 Heatwave
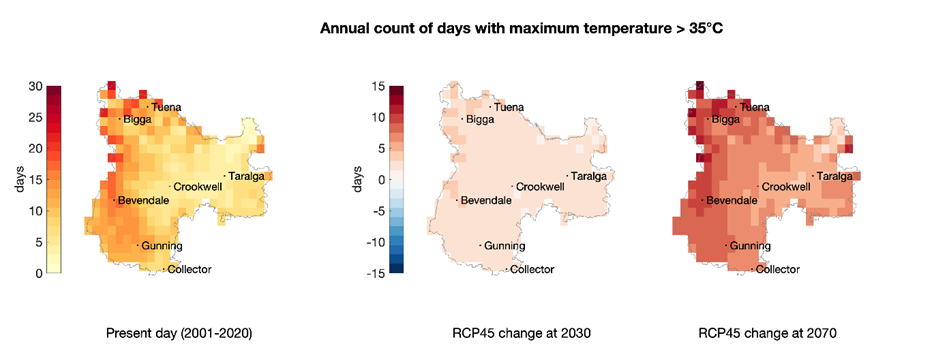
- Based on projections undertaken by Risk Frontiers in 2021, the largest heatwave increases will be seen during the summer months and high temperature extremes will occur more frequently during spring and autumn. This will have significant impacts on human health.
 Earthquake
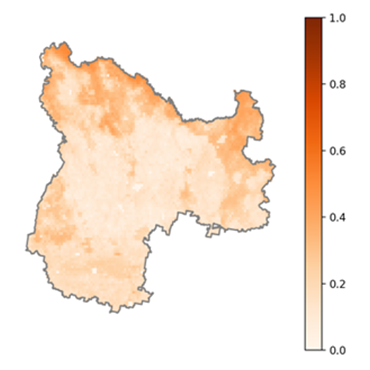
- Earthquake hazard in NSW is higher toward the south of the State around the ACT and near the Victoria border – particularly LGAs of Yass Valley, Upper Lachlan Shire and Queanbeyan-Palerang Region. 41
- The Dalton-Gunning Earthquake Zone has been assessed as one of the highest earthquake hazard areas in Australia with three instances of earthquakes of magnitude 5.5 or greater known to have occurred (November 1886, November 1934, and March 1949). 42 Specifically:
- The November 1934 impacted the town of Gunning, causing major damage, severely impacting stone and brick buildings. 43
- The 1949 earthquake severely impacted the town of Dalton where “buildings swayed crazily, walls cracked, chimneys toppled, water burst, and more than 100 bottles of liquor in an hotel were smashed.” 44
- More recently, a magnitude 3.2 earthquake hit gunning in September 2024, causing minor damage. 45
- On 9 August 1984, a magnitude 4 earthquake occurred which caused minor damage at Oolong (south of Dalton), damaging buildings in the locality. Buildings in Dalton were also affected where it knocked the cross crooked on St Matthews Anglican Church (in Jobson Street, Dalton). The epicentral intensity was relatively high because the earthquake was very shallow; and 46
- Based on potential event probability as provided by Risk Frontiers, annual average loss of residential, commercial and industrial buildings due to earthquakes is estimated at 28 per cent. This accounts for low probability but high cost consequence of earthquake activity.
Actions undertaken or proposed:
- No actions have been taken or proposed to address earthquake risks by Council.

Heatwave – measured by number of days with temperatures greater than 35°C
Drought – measured by Keetch-Byram Drought Index, soil moisture and annual precipitation


Bush and grassfire – measured by the annual maximum Forest Fire Danger Index (FFDI)

Extreme rainfall and flooding –measured by daily precipitation over 30mm

Severe storm, wind and hail – measured by East Coast Low (ECL) days and annual windspeed