
The Snowy Monaro Region is vulnerable to a wide range of natural hazards , making it essential to understand the nature and extent of exposure to people, buildings, infrastructure, services, or natural resources to effectively assess and address associated risks.
Exposure can be seen in various forms:
- Relative exposure is a function of hazard, describing the frequency and magnitude of natural hazard events and capturing the compounding effect of multiple hazards (fire and flood for this analysis). Where a community is subject to both fire and flood, it is potentially less resilient than one exposed to a single hazard of the same frequency and magnitude;
- The physical exposure of a community is determined such that the quantum of exposed people, buildings, essential facilities, industry, and agriculture can be evaluated. The physical vulnerability of exposed elements is also important, such as the age and construction type of buildings (for example, buildings with raised floors are more resilient to flood as they provide greater protection to the occupants and their belongings, resulting in less loss of life and property); and
- Social vulnerability is determined by examining socio-economic and demographic factors that may exacerbate or ameliorate the effects of an external threat to a person’s life, livelihood, or assets. Examples of these types of indicators include age, occupation, health status, income and education.
The Resilience Blueprint identified the following hazards as relevant hazardous events for the southeast NSW region. In 2024 the State Disaster Mitigation Plan (SDMP) was implemented and any additional hazards or information regarding exposure of hazard in the region has been included below:
 Fire (bushfire and grassfire)
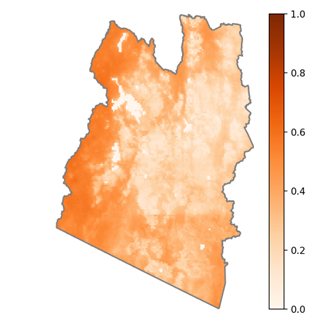
- Bush and grass fires are known to affect the LGA, with much of the rural areas identified as being within very high / high risk land;
- The bush fire season generally runs from October to March. In some years, good summer rains, drier than normal autumn conditions, severe winter frosts and gale force winds have created a further fire danger period throughout the winter months; 29
- The Snowy Monaro Region experiences, on average, 54 bushfires per year, of which two can be considered major fires; 30
- Based on the potential event probability, as provided by Risk Frontiers, annual average loss of residential, commercial and industrial buildings from flood in the LGA is 24 per cent under a RCP 4.5 scenario. This accounts for a moderate probability of occurring but a high financial cost consequence of bushfire activity;
- There have been a number of significant bushfire events in the Snowy Monaro Region. In the summer of 2019/2020 significantly impacted the Snowy Monaro Region. Approximately 14% of the LGA was directly burnt by the fires (approximately 15,000 square kilometres of land), destroying 100 properties and 45% of all forestry land in the LGA. The fires also had flow on effects to tourism, effectively destroying the Selwyn Snowfields. 31 The 2019/20 bushfire season has shown the Snowy Monaro Region’s susceptibility to bushfire.
Actions taken or proposed:
- Council’s Local Strategic Planning Statement (LSPS) considered risks associated with bushfires as a major issue affecting much of the Snowy Monaro Region. Planning Priority 11 of the LSPS is to “foster resilient, enduring and safe local communities using land use planning controls which address local and regional natural hazards.” It includes several actions for Council to achieve this priority; 32
- Council has prepared the Draft Settlements Strategy, which provides a strategic land use planning direction for all towns in villages in the LGA, including identifying specific locations where future development intensification be avoided due to bushfire risk.
 Flooding
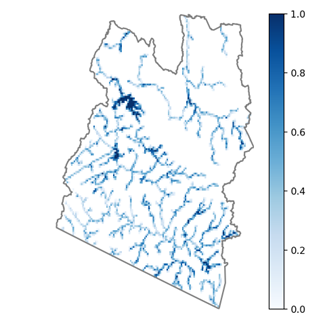
- There are urban areas in the LGA that have flood prone land, these being Berridale, Bredbo, Cooma, Michelago, and Bombala. Various localities in certain locations are also deemed to be susceptible to flooding in major events;
- There are seven dams within the Snowy-Monaro Region. These include Tantangra, Cowarra Creek Tailings, Eucambyne, Guthega, Island Bend, Jindabyne and Delegate Flood Detention Basin; 33
- Flood risk at Berridale is present from Myack Creek and Colamatong Creek where high creek flows overtops the channel banks and spreads over roads and property. Coolamatong Creek, which runs through the town, has minimal channel capacity and spreads onto main roads including Jindabyne Road and Myack Street, as well as low-lying properties. Coolamatong Creek tends to cause less property flooding but can cause hazardous road flooding at several road crossings. Kosciuszko Road, which is a main arterial road providing access to Berridale and the NSW ski resorts, can also be flooded by Wullwye Creek/Myack Creek around 2km north-east of town; 34
- Bredbo has relatively little flood affectation in smaller flood events, but in those events of 5% AEP and larger, the Bredbo River can cause widespread inundation of roads and properties in the southern portion of the town. There is a second, smaller watercourse also traverses through the town that can cause flooding at several locations. Flood risk is also present from the Murrumbidgee River; 35
- Cooma has significant flood affectation along sections of Cooma Creek and Cooma Back Creek, particularly in flood events of 10% AEP (annual exceedance probability) and larger where the parts of the levee are overtopped. On Cooma Creek, property and road flooding occur when parts of the levee are overtopped, with the potential for severe flooding particularly around Sharp Street and Commissioner Street. Cooma Back Creek also has the potential to flood roads and properties, with a flooding hotspot in the section of creek of north of Sharp Street which is subject to high risk flooding. There is a third creek flooding hotspot near the confluence of the two creeks, near Mulach Street. In addition to creek flooding, flooding occurs in the Polo Flat industrial area, and in some residential areas due to overland flow. 36 Historically, Cooma has been affected by a number of flood events, including in 1991 where 43 residences and 10 businesses were damaged. In 1956, almost 60mm of rain fell in 90 minutes, which quickly inundated much of the town.
- Michelago has relatively little flood affectation compared to other towns, with most areas of Michelago Creek’s floodplain away from dwellings and roads. While in very rare events (eg. 0.2% AEP) very few dwellings are directly affected by creek flooding, there is potential for severe inundation across the town in the Probable Maximum Flood (PMF); 37
- Bombala is known to be affected by flood and Council has sought to restrict development in low lying areas potentially vulnerable to flooding. Bombala has experienced major floods in the past, most notably in 1971, 1952 and 1983; and 38
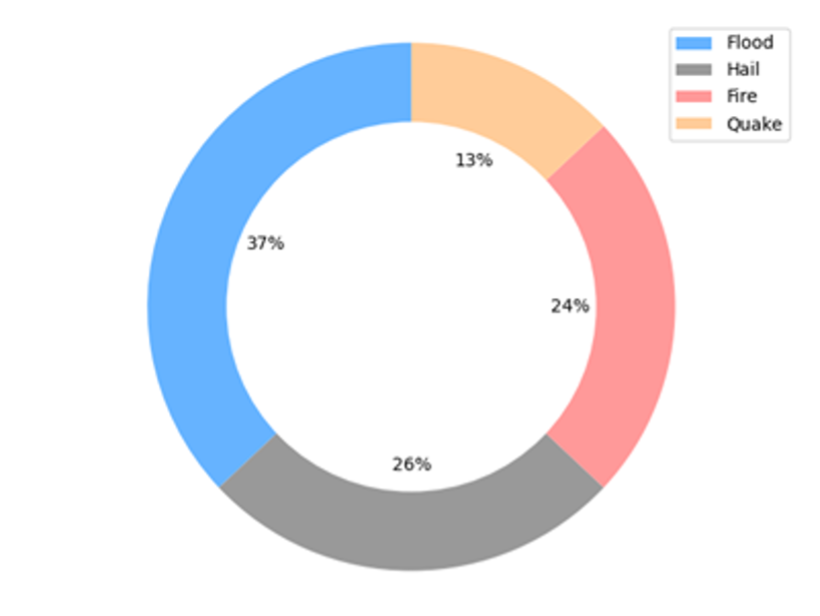
- Based on the potential event probability, as provided by Risk Frontiers, annual average loss of residential, commercial and industrial buildings from flood in the LGA is 37 per cent under a RCP 4.5 scenario. This accounts for a moderate probability occurring and a high financial cost consequence of flood activity.
Actions taken or proposed:
- Council’s Local Strategic Planning Statement (LSPS) considered risks associated with floods as a major issue affecting much of the Snowy Monaro Region. Planning Priority 11 of the LSPS is to “foster resilient, enduring and safe local communities using land use planning controls which address local and regional natural hazards.” These include: 39
- Action 11.2 is that “Council will implement flood planning controls based on flood risk management plans for Berridale, Bombala, Bredbo, Cooma and Michelago” as a short/medium -term action; and
- Action 11.4 is that “Council will work with Snowy Hydro to use flood data to inform planning decisions around Lake Jindabyne and Eucumbene.”
- Council has prepared the Draft Settlements Strategy, which provides a strategic land use planning direction for all towns in villages in the LGA, including identifying specific where future development intensification be avoided due to flooding risk; and
- Council have prepared the Floodplain Risk Management Studies and Plans Report, November 2020, which includes various strategies and actions to better respond to the flood risk present (particularly in Cooma).
 Severe storm
- Severe storms in NSW are often associated with East Coast Lows (ECL). ECL events are extreme weather systems that occur in South-East Australia, bringing extreme winds, rain, hail and lightening;
- The maximum annual windspeed is projected to increase across the LGA;
- Severe storms (with accompanying lightening, hail, wind snow and / or rain causing severe damage (including tornado) is identified as a likely natural hazard event in the region with moderate consequence in Council’s EMPLAN; and
- Based on the potential event probability, as provided by Risk Frontiers, annual average loss of residential, commercial and industrial buildings from hail damage associated with a storm in the LGA is 26 per cent under a RCP 4.5 scenario. This accounts for a moderate probability of occurring but a high financial cost consequence of severe storm activity.
Actions taken or proposed:
- The Snowy Monaro Local Emergency Management Committee has prepared the EMPLAN to produce arrangements that provide the basis for managing emergency impacts in the Snowy Monaro Region, including landslides.
Snow
- The Snowy Monaro Region is subjected to a number of snow falls each year, with most of these events causing little if any disruption to communities or any of the travelling public; and
- While snowfalls do regularly occur in the higher alpine areas of the Region (where they are well prepared and equipped to address seasonal snow falls and blizzards, even if they are severe), medium to heavy snow falls can occur on the lower elevations accompanied with damaging winds and associated disruptions to the community; 40
- Examples of significant snow falls in the Snowy Monaro Region include: 41
- On 1 July 1987, the Snowy Monaro received heavy snowfalls (the highest since 1949). Areas around Bombala, Nimmitabel and Delegate had between one and two metres of snow, closing roads and bringing down power and telephone lines. The snow remained on the ground for up to two weeks and a million sheep were caught without shelter and food;
- On 17-18 July 2003, snow closed all roads in the Cooma/Bombala/Jindabyne area of the Southern Tablelands; and
- Snowfalls of up to 40 cm were recorded in the Jindabyne area from 8-10 July 2005, isolating towns for several days and cutting power supplies for two days.
Actions taken or proposed:
- The State Emergency Service (SES) has implemented a South Eastern Region Snow Emergency Sub Plan with key strategies and actions.
 Landslide
- Landslide can be triggered by severe weather events (e.g. heavy rainfall) or human activities (vegetation removal, overgrazing, slope modification, etc.); and42
- The probability of landslides in the region are considered rare, but the level of consequence can be high depending on the location. This risk is higher in parts of the LGA with steep topography;
- While landslides are considered a rare occurrence, they do indeed occur. In July 1997, a landslide at the ski resort village of Thredbo occurred resulting in approximately 2,000 cubic metres of rock shifting. As a result, 19 victims were buried in a ski lodged after it was lodged off its foundations. Eighteen bodies were recovered and one survivor was rescued from under debris more than 60 hours later. 43
Actions taken or proposed
- The Snowy Monaro Local Emergency Management Committee has prepared the EMPLAN to produce arrangements that provide the basis for managing emergency impacts in the Snowy Monaro Region, including landslides; and
- Action 11.7 in the Snowy Monaro LSPS identifies that “Council will map landslide risk and include relevant planning controls.”
 Heatwave
- A heatwave is generally defined as ‘a period of abnormally hot weather lasting over several days’, and can be characterised as three or more days of high maximum and high minimum temperatures that are unusual for that location’; and 44
- The area is climatically diverse and is predominantly cool temperate, with higher elevation areas having greater daily extremes (colder winters and hotter summers). The Snowy Monaro Local Emergency Management Plan (EMPLAN) denoted the risk of heatwaves as being low. 45
Note: The Snowy Monaro Region is not exposed to this hazard, however heatwaves are a hazard for wider South East NSW Region and may have consequential impacts to the Snowy Monaro Region.
Actions taken or proposed:
- The Snowy Monaro Local Emergency Management Committee has prepared the EMPLAN to produce arrangements that provide the basis for managing emergency impacts in the Snowy Monaro Region, including heatwave.
 Tsunami
- Tsunami’s can be generated by a number of causes, however, undersea earthquakes are the most likely to generate such an event. Tsunami waves can run up beyond the high tide mark causing significant damage to coastal areas.
Note: The Snowy Monaro Region is not exposed to this hazard, however tsunami’s are a hazard for wider South East NSW Region and may have consequential impacts to the Region.
Actions taken or proposed:
- No actions have been taken or proposed for to address storm and cyclone risks within the Council area.
 Earthquake
- The Canberra Region sits on a major eastern fault line. The nearest seismic zone is to the north near the township of Gunning. Earthquakes occuring to the north of the Snowy Monaro Region are known to occur on occasion. On 15 February 1998, a magnitude ML 4.2 earthquake occurred in the Brindabella Mountains, near Brindabella Homestead, this earthquake was large enough that it was felt in Cooma; and 46
- Based on the potential event probability, as provided by Risk Frontiers, annual average loss of residential, commercial and industrial buildings from flood in the LGA is 13 per cent under a RCP 4.5 scenario. This accounts for a low probability of occurring but a high financial cost consequence of earthquake activity.
Actions taken or proposed:
- The Snowy Monaro Local Emergency Management Committee has prepared the EMPLAN to produce arrangements that provide the basis for managing emergency impacts in the Snowy Monaro Region, including earthquakes.


Heatwave – measured by number of days with temperatures greater than 35°C


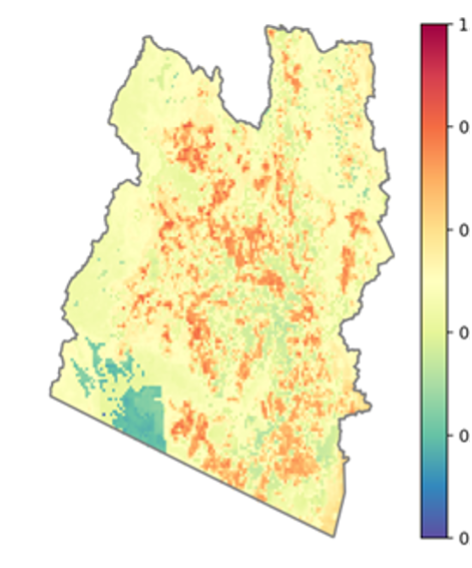
Drought – measured by Keetch-Byram Drought Index, soil moisture and annual precipitation


Bush and grassfire – measured by the annual maximum Forest Fire Danger Index (FFDI)

Extreme rainfall and flooding – measured by daily precipitation over 30mm

Severe storm, wind and hail