Home » Your Local Area » Hilltops
Local Profile for Hilltops Council
Hilltops Council Local Government Area
Hazard Exposure Summary
Climate Change Data Summary
Risk Exposure Summary
Reference
Hilltops Council region is a local government area (LGA) centrally located between Canberra, Wagga Wagga and Orange, with a land cover of 7,140 square kilometres. ¹
Hilltops LGA is the traditional homelands of the Ngunnawal tribe and Wiradjuri tribe.
Traversing the Hilltops region are major transport corridors such as the Hume Highway (the busiest interstate freight corridor in Australia) and the Sydney to Melbourne trainline. ²
Socio-Demographic Profile
In 2024, the estimated residential population for Hilltops was 19,300 persons. ³
In 2021, based on the Australian Bureau of Statistics (ABS) 2021 census data, the LGA consisted of:
- Population – 19,254; ⁴
- Aboriginal and Torres Strait Islander population – 5.1% (976persons);⁵
- No of properties/dwellings – 9,222; ⁶
- Persons aged under 5 – 5.9% (1,128 persons); ⁷
- Persons aged over 65 – 24.2% (4,631 persons); ⁸
- Persons with disability – 7.1% (1,368 persons); ⁹
- Number of new residents – 46 (since 2022);
- Persons culturally and linguistically diverse (CALD) / non English speaking at home – 5.3% (1,013 persons); 10 and
- Top 5 languages spoken at home are Arabic, Filipino/Tagalog, Mandarin, Punjabi, Spanish. 11
Based on recently revised population projects from the NSW Department of Planning, the population of the Council area is expected to grow to 20,165 people by 2041 (-505 by natural change and +1,447 by migration). A link to further information outlining growth trends in Goulburn Mulwaree, including graphs can be found here: https://www.planning.nsw.gov.au/data-and-insights/population-projections/explore-the-data#-local-government-area-projections-
Economic Profile
Hilltops LGA has a diverse economy, providing a range of services and diverse employment and economic opportunities for residents and investors. 12
Agriculture, Forestry and Fishing remains a key industry, generating $328 million in 2022/2023. $307.9 million was generated through agriculture, while $20.3 million was generated through Agriculture, Forestry and Fishing Support Services. 13
The top three industries employing local workers in Hilltops LGA in 2022/2023:
- Agriculture, Forestry and Fishing (17.9%);
- Retail trade (12.7%); and
- Health Care and Social Assistance (11.6%). 14
Mining had the highest productivity by industry in 2022/23 in the LGA. 15
Hilltops Council area’s Gross Regional Product (GRP) was $1.27 billion in the year ending June 2023, growing 4.9% since the previous year. 16
Environmental Profile
Hilltops Council area is situated on the Southern Slopes which traverses both the Murrumbridge and Lachlan River catchment boundaries.
The region has an immense diversity in landscape and soil types which is prime for agricultural activities. 17 The landform and topography or the region are characterised by flat pastoral lands, high elevation alpine regions and densely vegetated valleys.
The primary land use of the region is primary production which accounts for 95% of the total land area of the LGA. This is followed by primary production small lots, and large residential lots.
Water is supplied to the main townships and most of the LGA through the Goldenfields Water County Council which extracts and treats water from the Murrumbidgee River.
Booroowa has its own treated water supply operated by Council and the villages of Koorawatha and Bendick Murrell are supplied with water from Cowra Shire. 18
Governance Profile
The Hilltops area has a population which primarily reside in the townships of Young, Harden-Murrumburrah, and Boorowa with the remainder of the population spread out across the region’s various villages and vast rural areas. 19
The Hilltops area is predominately rural, and the economy is largely agriculturally orientated. Rural lands are used for sheep and cattle grazing, grain growing and orcharding (particularly cherries), with other important industries being viticulture and limestone mining. 20
The Hilltops LGA is the traditional homelands of the Ngunnawal tribe and Wiradjuri tribe. The Wiradjuri country is notably recognised as the largest country of Aboriginal and Torres Strait Islander people in Australia. Both are represented by the Young Local Aboriginal Land Council and the Onerwal Local Aboriginal Land Council. 21
The council has 9 elected Councillors, for a fixed four-year term. The Mayor and Deputy Mayor are elected by the Councillors and is recognised as the civic leader of the community, also serving fixed 4-year terms.
Hazard Exposure Summary
The LGA is vulnerable to a wide range of natural hazards , making it essential to understand the nature and extent of exposure to people, buildings, infrastructure, services, or natural resources to effectively assess and address associated risks.
Exposure can be seen in various forms:
- Relative exposure is a function of hazard, describing the frequency and magnitude of natural hazard events and capturing the compounding effect of multiple hazards (fire and flood for this analysis). Where a community is subject to both fire and flood, it is potentially less resilient than one exposed to a single hazard of the same frequency and magnitude;
- The physical exposure of a community is determined such that the quantum of exposed people, buildings, essential facilities, industry, and agriculture can be evaluated. The physical vulnerability of exposed elements is also important, such as the age and construction type of buildings (for example, buildings with raised floors are more resilient to flood as they provide greater protection to the occupants and their belongings, resulting in less loss of life and property); and
- Social vulnerability is determined by examining socio-economic and demographic factors that may exacerbate or ameliorate the effects of an external threat to a person’s life, livelihood, or assets. Examples of these types of indicators include age, occupation, health status, income and education.
The Resilience Blueprint identified the following hazards as relevant hazardous events for the southeast NSW region. In 2024 the State Disaster Mitigation Plan (SDMP) was implemented and any additional hazards or information regarding exposure of hazard included below:
Bushfire and grassfire
- The townships of Boorowa, Eastern Boorowa, Harden, Young, and Crowther / Murringo are identified have been specifically identified as having an unacceptable bushfire risk and require additional, targeted treatment strategies. These include fuel management, ignition prevention, increasing community preparedness and area specific response plans. 22
- The frequency of dangerous bushfire weather days and the magnitude of bushfire weather extremes will increase in the Shire;
- Grassfires can become common on hot days and heavy winds;
- Based on potential event probability, annual average loss of residential, commercial and industrial buildings due to bushfire is estimated at 8 per cent. This accounts for low probability but high-cost consequence of bushfire activity.
Actions taken or proposed:
- Council’s Local Strategic Planning Statement includes a priority that:
- Reduce the risk from natural hazards, by establishing adaptation strategies to minimise vulnerability to heatwaves and high temperatures, reduced and more variable rainfall, severe winds and severe storms and hail. 23
An action identified in the Council’s Community Strategic Plan, includes as an action:
- “D.9. Sustaining land planning and management measures that adapt to changing demands and pressures, including those emerging relating to community health (e.g. heat stress, sun cancer and obesity), climate change, and increasing rate and scale of natural hazards including drought, bushfires and flooding.” 24
Flooding
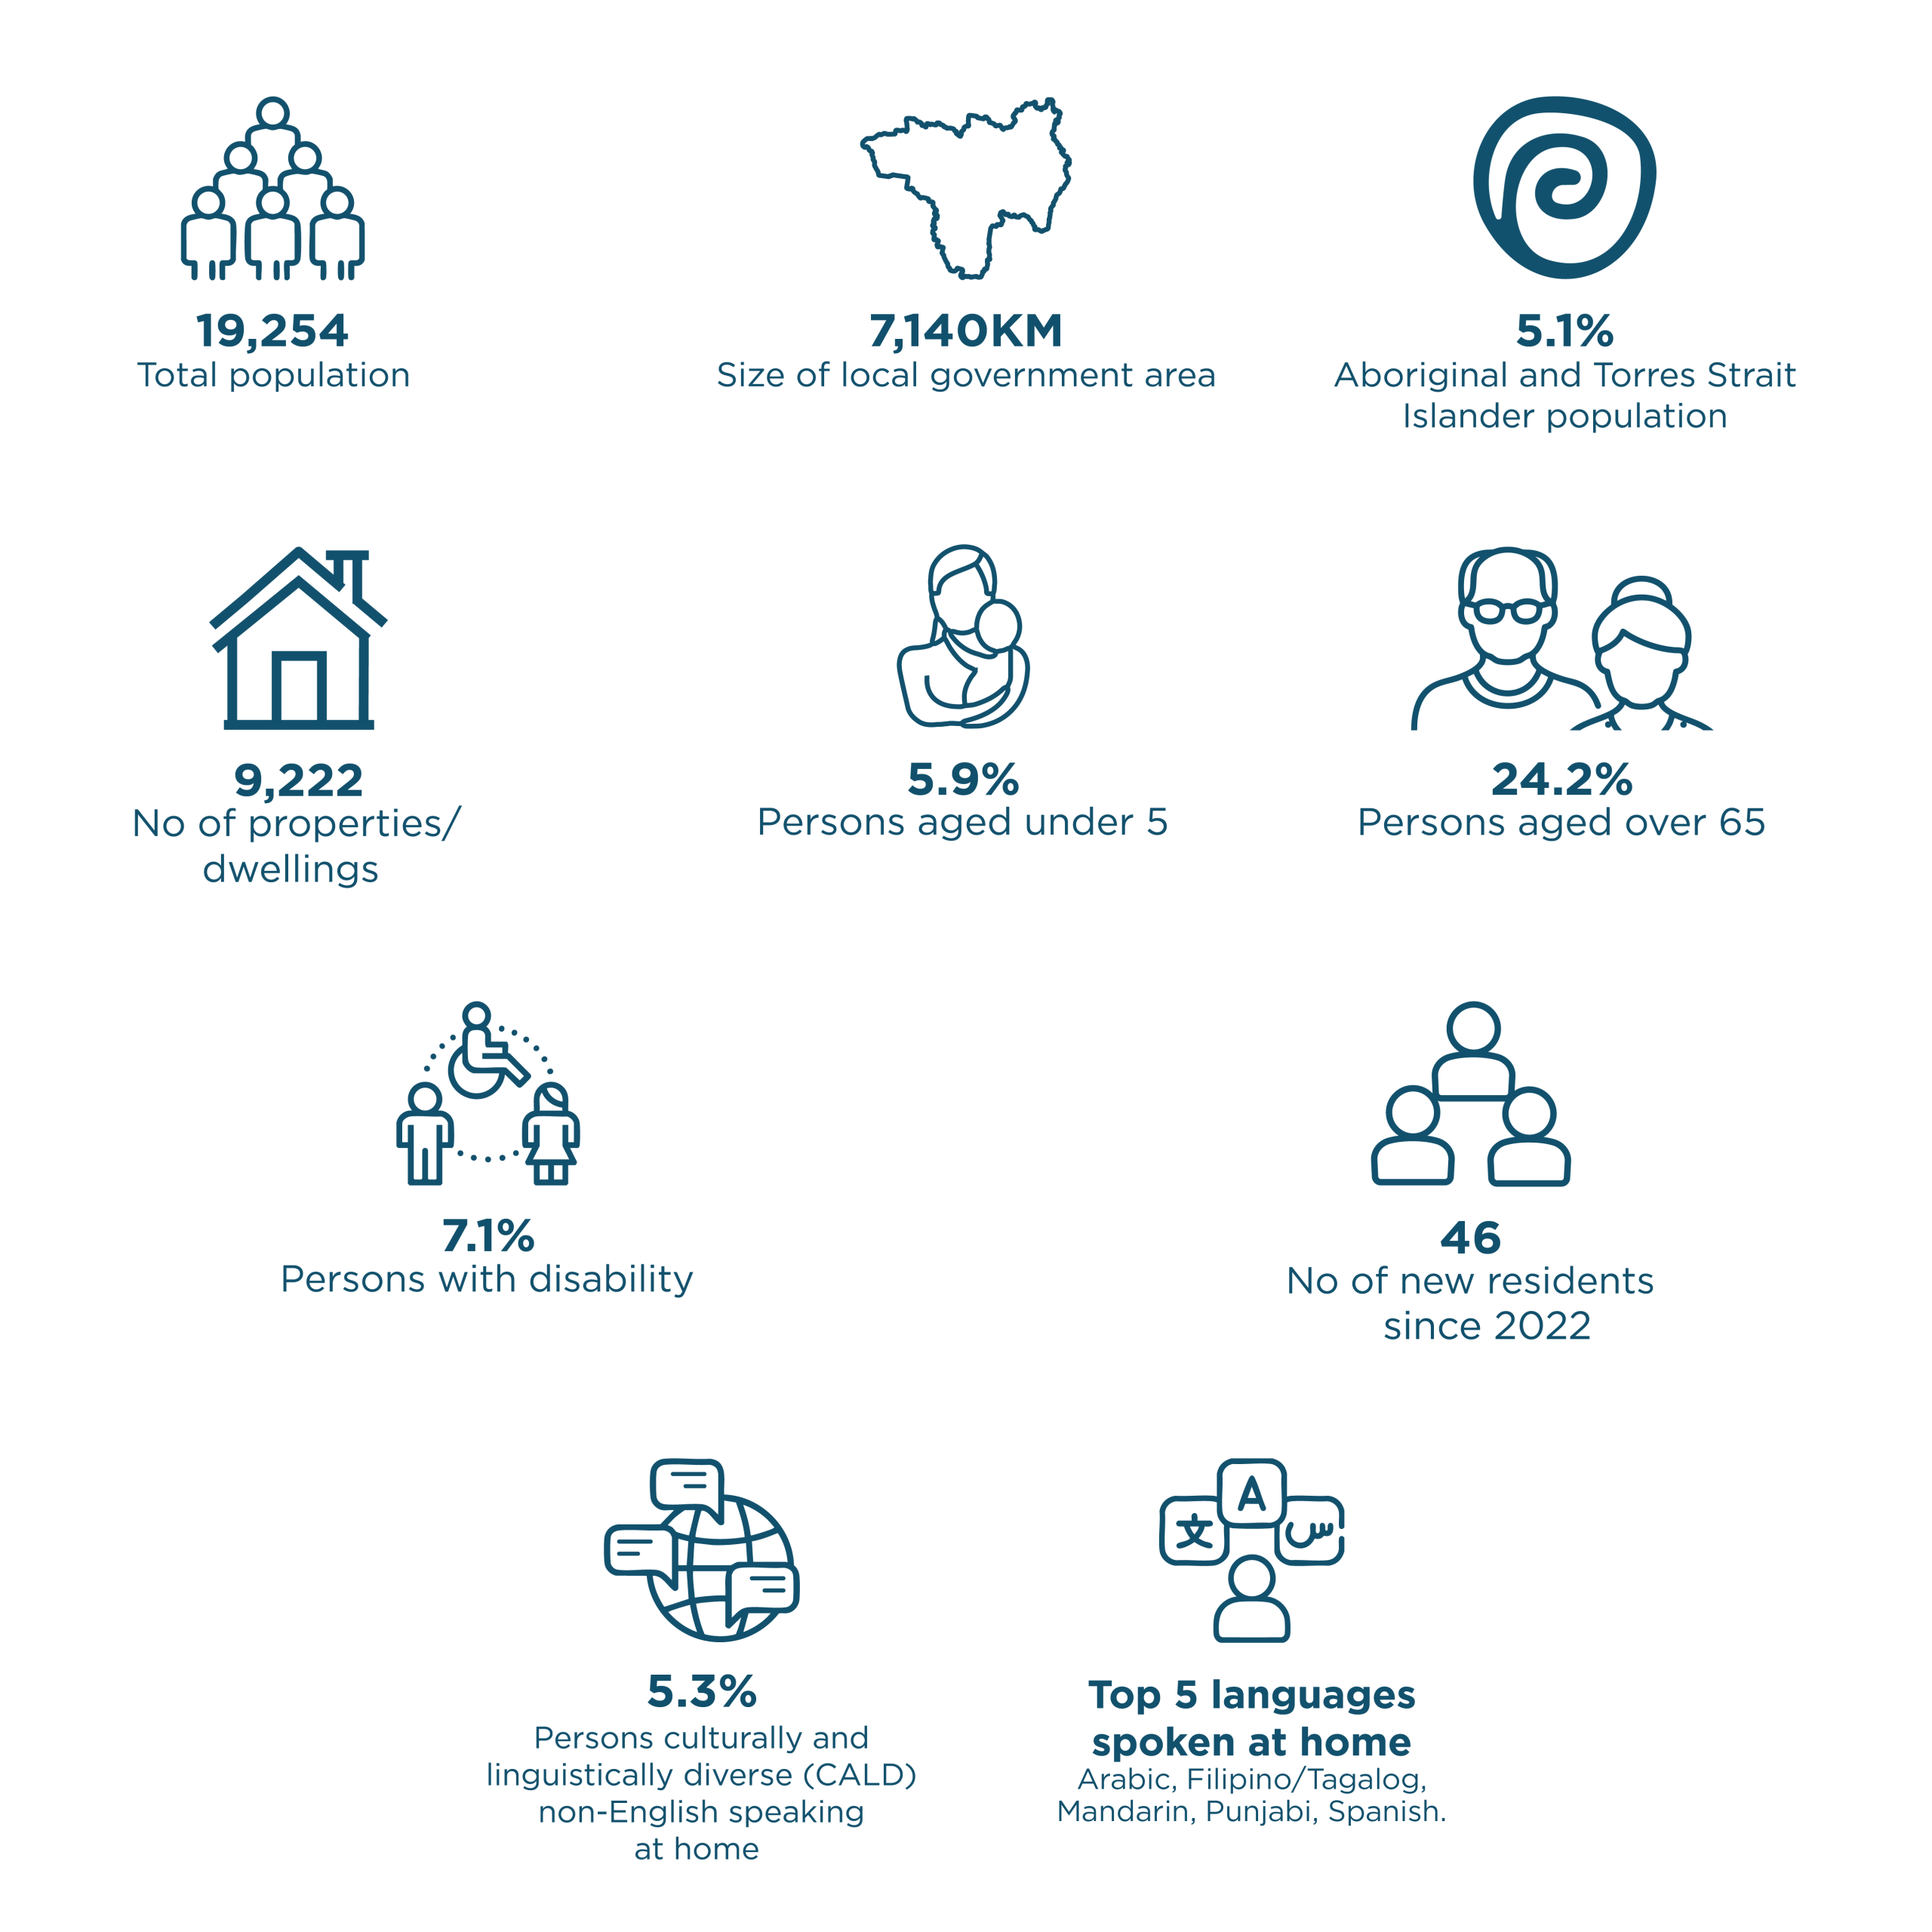
- Within the Hilltops LGA, there are 7,400 residential dwellings and a population of 19,260. It is estimated that 11.4% of the population, or 2,200 people in Hilltops are at risk of flooding. 25
- Significant flooding events are known to impact Hilltops Council, including:
- In Young, flooding has occurred recently in December 2010 and March 2012. The 2010 flood was the more severe; 26
- In Boorowa, the June 1952, September 1974 and December 2010 floods. These were identified as the most significant flood events at Boorowa. The December 2010 flood resulted in a 7.58m flood which was estimated to correspond to a 2% AEP event. The June 1952 flood is considered to be the largest for Boorowa; 27
- In Jugiong, the 1974 event has an AEP of approximately 2%. Flooding is known to have occurred often in Jugiong with numerous large floods including the 1925, 1950, 1974, 1991, 1993 and 2010 events; and 28
- In Murrumburrah, Harden, the major flood of record was set in 1930, where flooding from Currawong Creek caused widespread inundation of homes, destruction of buildings and infrastructure including the main Albury Street Bridge over Currawong Creek. This event was in the order of a 1% AEP event (that is, less than 1% chance of similar flooding occurring in any given year), or possibly rarer. 29 The September 2016 flood at Murrumburrah-Harden was the largest reported flood for Cunningham Creek. Major flooding has occurred in Murrumburrah- Harden more recently in both October 1993, December 2010, and September 2016. 30
- Council has commissioned a number of flood studies to better understand current and future anticipated flood behaviour in the various river catchments and sub-catchments and their floodplains, including:
- Young Floodplain Risk Management Study and Plan November 2015 (prepared by Lyall & Associates and Nexus Environmental Planning Pty Ltd);
- Boorowa Flood Study, March 2017 (prepared by Lyall & Associates);
- Boorowa Floodplain Risk Management Study and Plan (prepared by Lyall & Associates and Nexus Environmental Planning Pty Ltd);
- Jugiong Floodplain Management Study and Plan (prepared by WMA Water);;
- Murrumburrah Flood Study, November 2020 (prepared by WMA Water); and
- Murrumburrah Floodplain Risk Management Study and Plan, November 2020 (prepared by WMA Water).
- Based on potential event probability as provided by the Risk Frontiers (2021), annual average loss of residential, commercial and industrial buildings due to flood is estimated at 3 per cent. This accounts for low probability but high-cost consequence of flood activity.
Actions taken and proposed:
- Council’s Local Strategic Planning Statement includes a priority that:
- Reduce the risk from natural hazards, by establishing adaptation strategies to minimise vulnerability to heatwaves and high temperatures, reduced and more variable rainfall, severe winds and severe storms and hail. 31
- The Local Strategic Planning Statement also includes an Action that the Council ensure that:
- “vulnerability to the impacts of flooding, bushfires, and severe storms and winds are minimised.” 32
- In 2023, Council have committed to undertaking the Young Stormwater Trunk Main Project33, which has been designed and is currently being constructed.
Severe storm
- A severe storm impacted the Hilltops LGA on 10 February 2025, resulting huge amount of large hailstones. the State and Federal Government activating disaster recovery support for affected areas, particularly the township of Harden34. A total of 67 properties were damages, with 12 being deemed uninhabitable and 13 inundated. 35
Note: for the purposes of this report, cyclone was not commented on.
Actions taken and proposed:
- Council’s Local Strategic Planning Statement includes a priority that:
- Reduce the risk from natural hazards, by establishing adaptation strategies to minimise vulnerability to heatwaves and high temperatures, reduced and more variable rainfall, severe winds and severe storms and hail. 36
- The Local Strategic Planning Statement also includes an Action that the Council ensure that:
- “vulnerability to the impacts of flooding, bushfires, and severe storms and winds are minimised.” 37
Landslide
- Landslide can be triggered by severe weather events (e.g. heavy rainfall) or human activities (vegetation removal, overgrazing, slope modification, etc.).38
Actions taken and proposed:
- No actions have been proposed or undertaken by Council.
Heatwave
- Heatwaves are commonly associated with protracted dry periods and can greatly affect human health and lead to loss of life. This is particularly true for those who are more vulnerable such as the elderly, the ill, and young children.
Actions taken and proposed:
An action identified in the Council’s Community Strategic Plan, includes as an action:
- “D.9. Sustaining land planning and management measures that adapt to changing demands and pressures, including those emerging relating to community health (e.g. heat stress, sun cancer and obesity), climate change, and increasing rate and scale of natural hazards including drought, bushfires and flooding.” 39
Climate Change Data Summary
- The climate change data presented above shows that the LGA is expected to experience hotter and drier conditions, with more fire danger days, increased drought, and slightly more storm days. However, there is expected to be a decrease in annual and extreme rainfall. Cold conditions, particularly frost nights are also project to decrease.

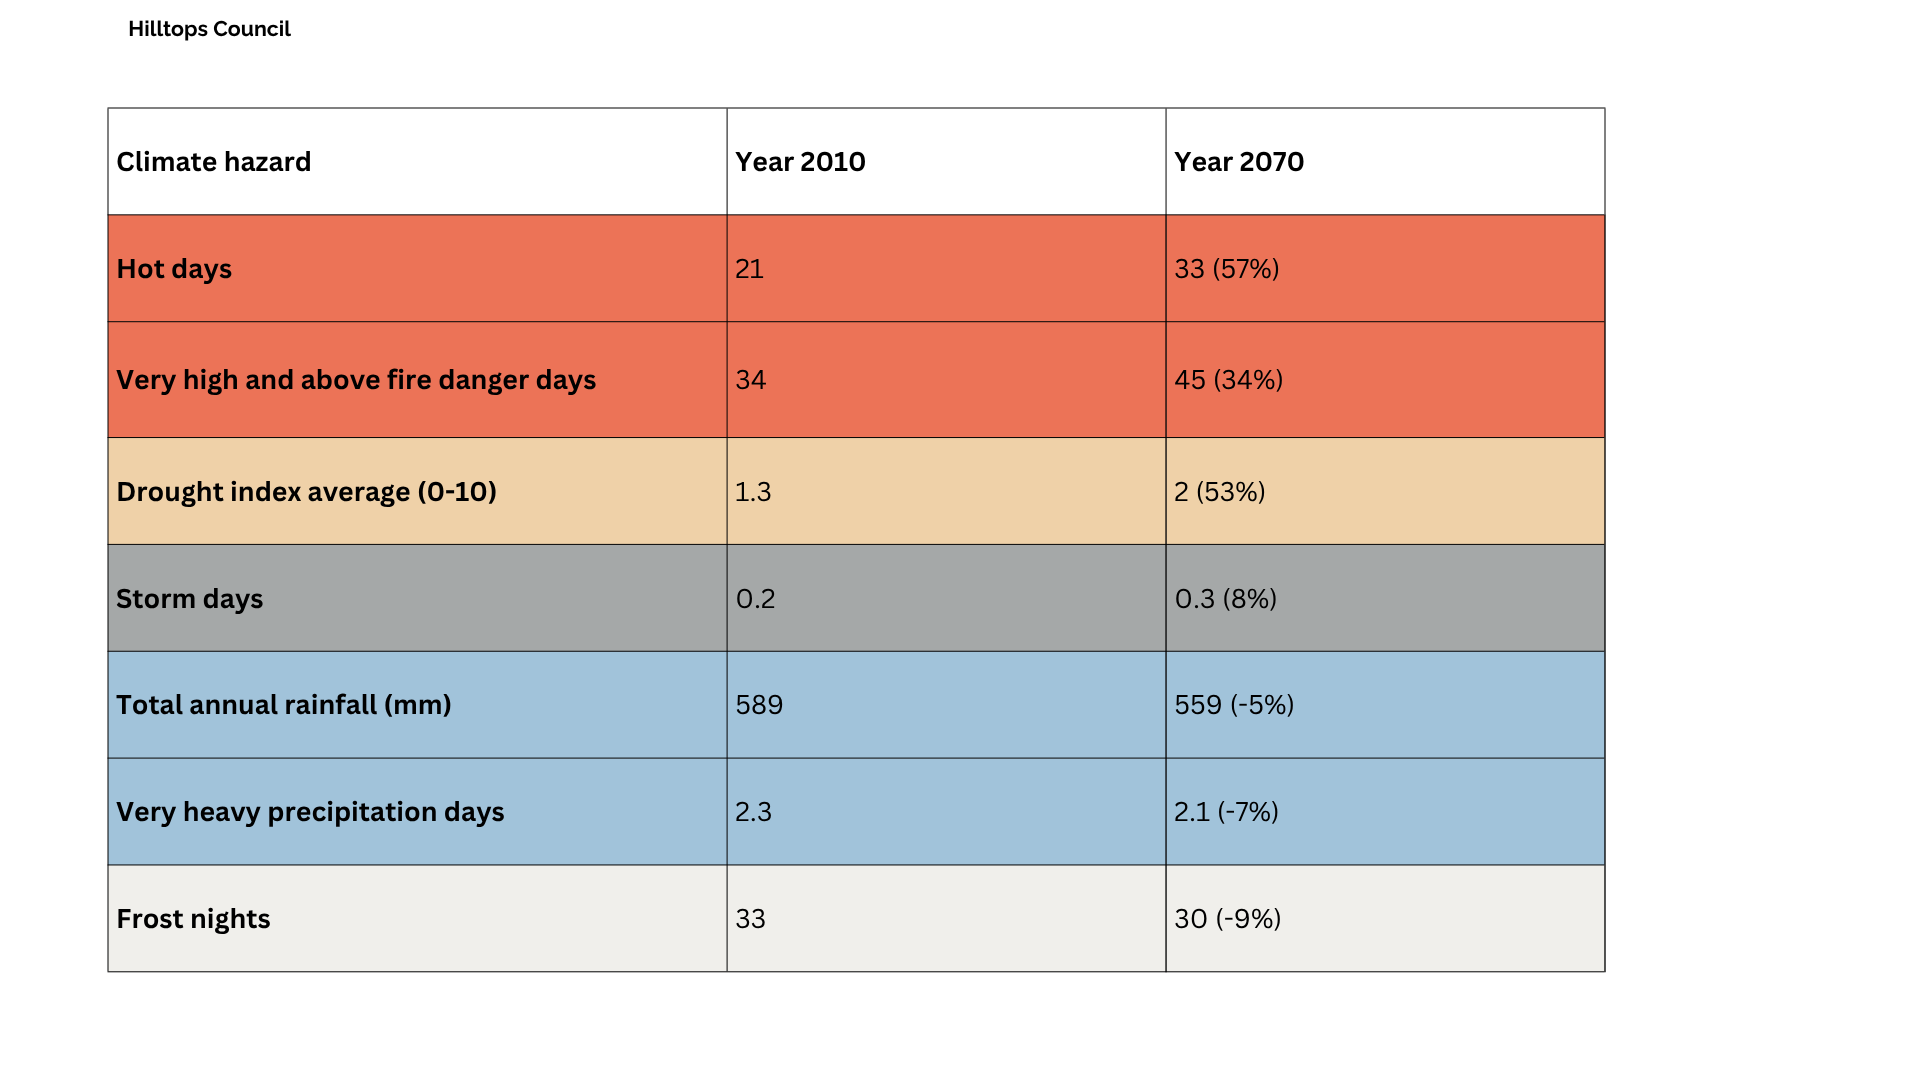
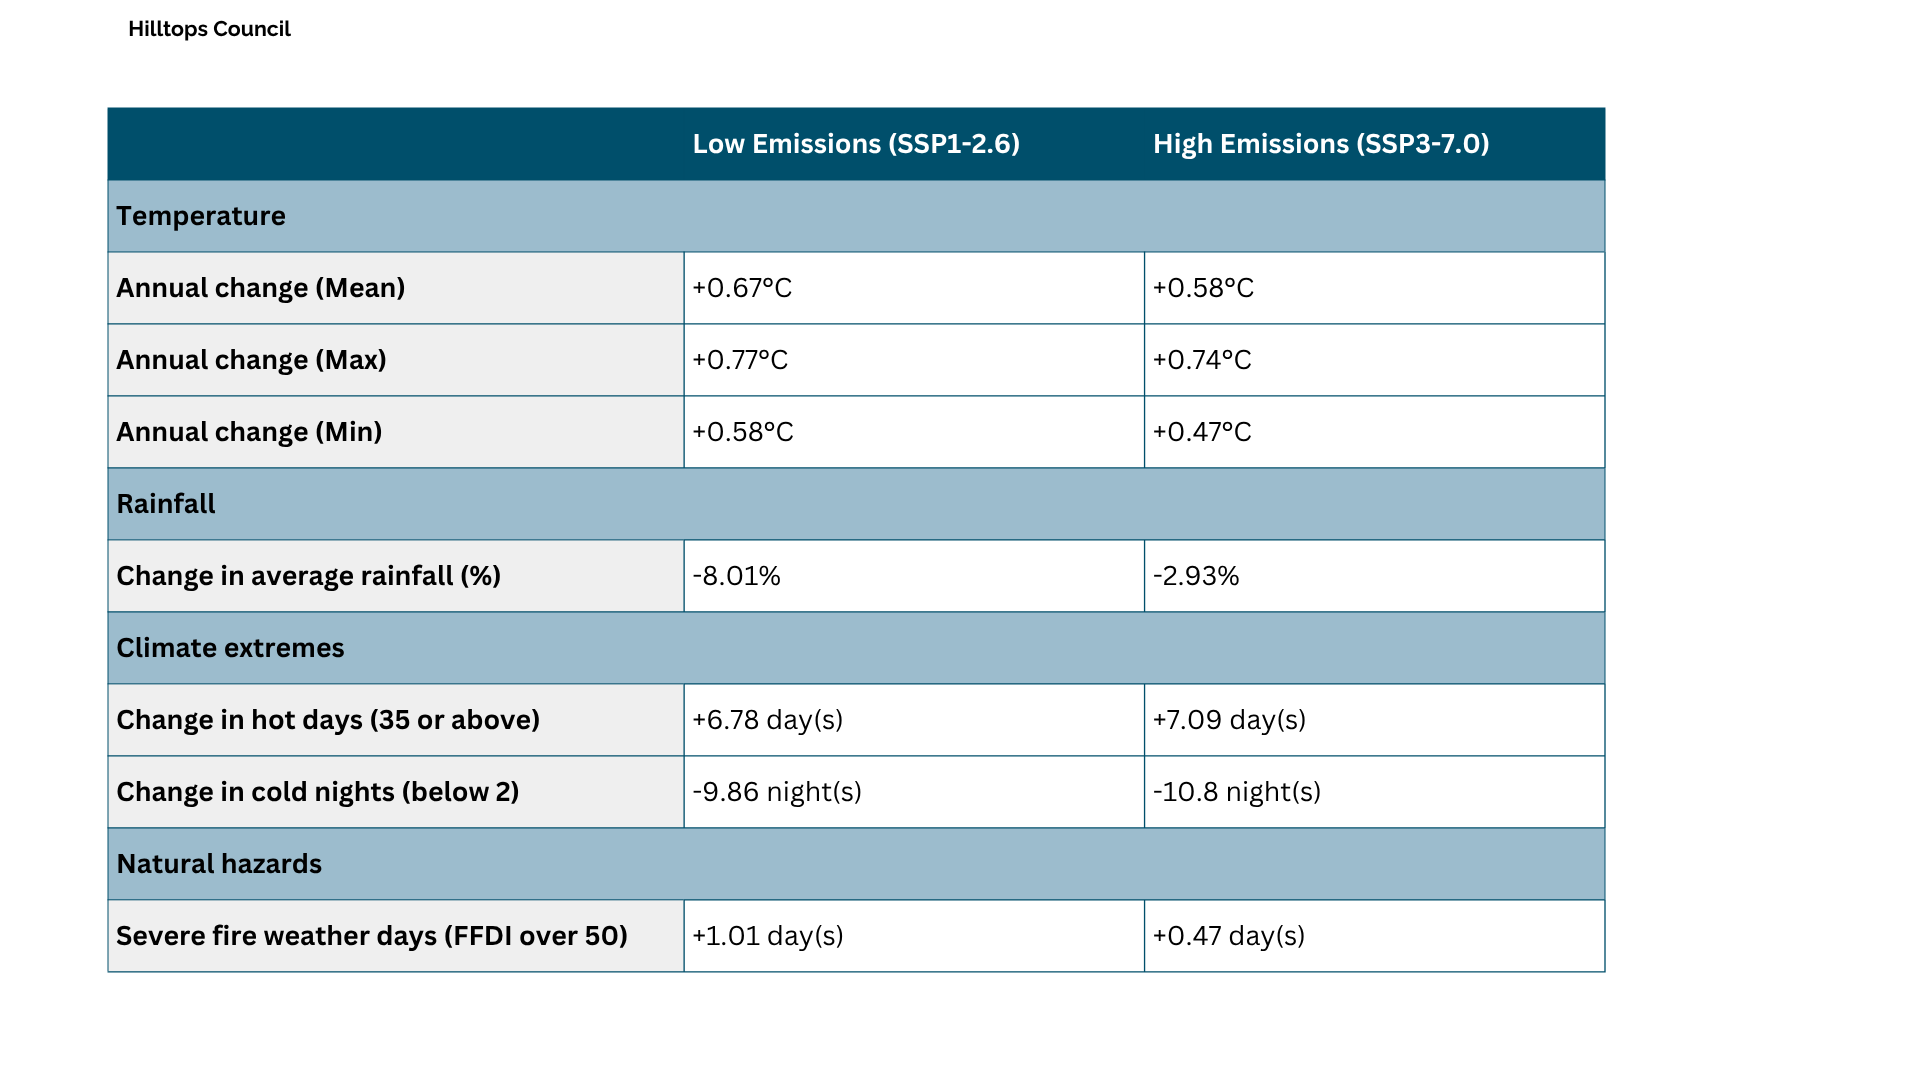
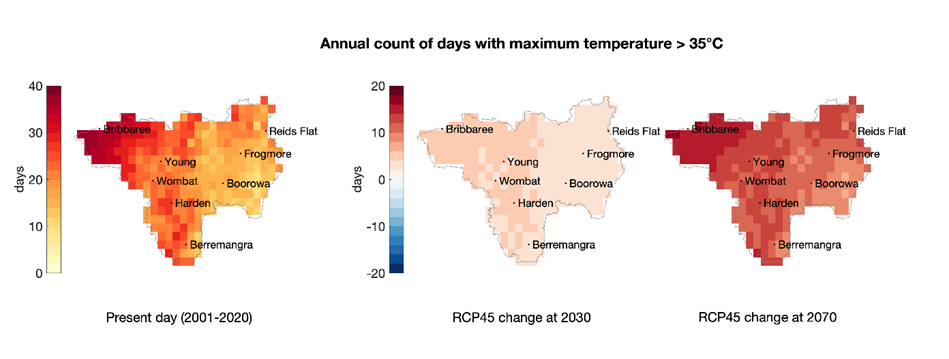
Heatwave – measured by number of days with temperatures greater than 35°C
Heatwaves are a critical climate hazard affecting health, infrastructure, and ecosystems. Heatwave risk can be measured by tracking the number of days per year with maximum temperatures exceeding 35°C. This analysis, undertaken by Risk Frontiers in 2021, drew on 20-year averages from historical climate reanalysis data and future climate model projections under a ‘medium’ emissions scenario, represented by RCP4.5 (see Figure 1 below).
Figure 1 – Frequency of days per year with temperatures greater than 35 Celsius Degrees
(Values are 20-year averages for present day climate and change for future climate under the RCP4.5 scenario.)
The data highlights how the frequency and seasonality of high-temperature events are expected to shift over time in the LGA, informing the need for climate adaptation in infrastructure, health, and planning decisions.
Key Findings:
- The magnitude of temperature extremes and frequency of hot days will increase in Hilltops.
- Largest increases in heatwave and high temperature extremes will be seen during the summer months.
- High temperature extremes will also occur more frequently during spring and autumn.

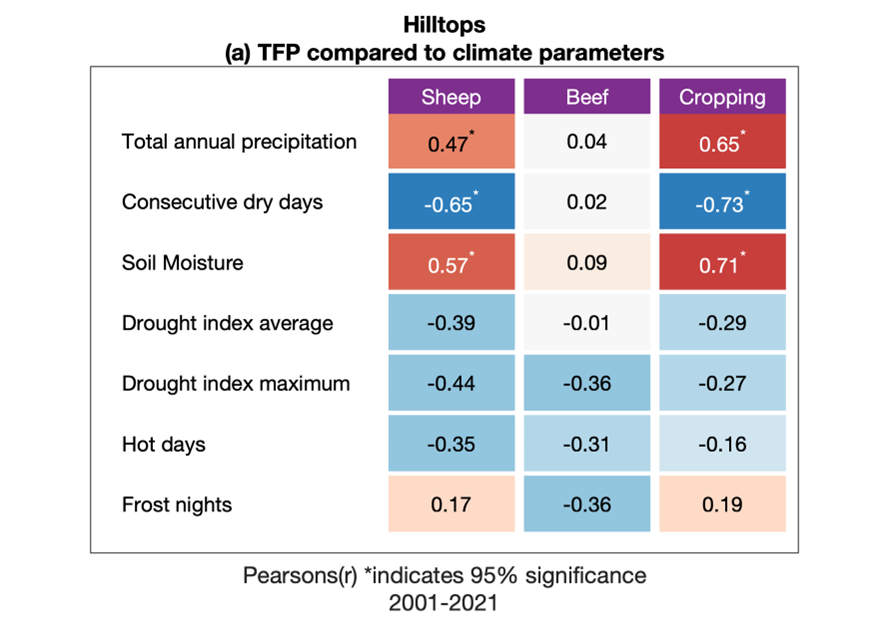
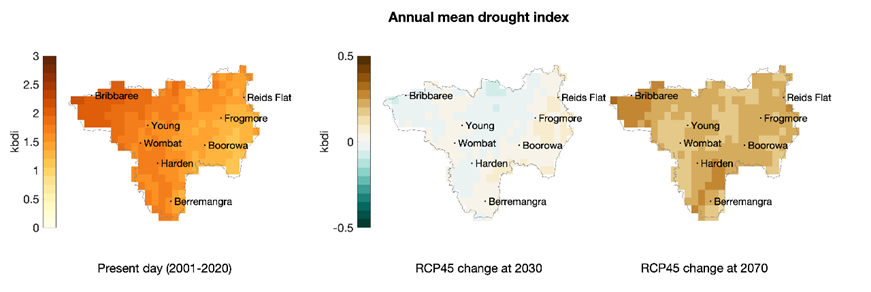
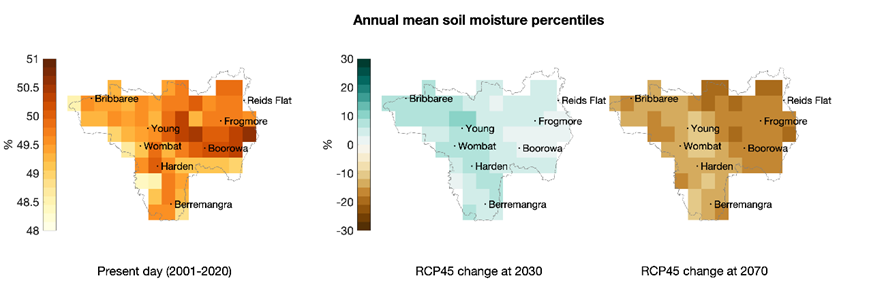
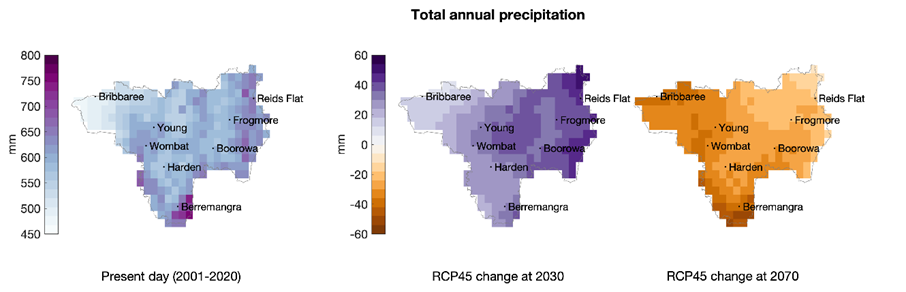
Drought – measured by Keetch-Byram Drought Index, soil moisture and annual precipitation
Drought is a complex hazard influenced by temperature, rainfall, and how water is retained in the landscape. To assess how drought conditions are projected to change in the LGA, this analysis undertaken by Risk Frontiers in 2021 used three key climate indicators:
- Keetch-Byram Drought Index (KBDI) – a widely used index that estimates how dry the landscape is based on temperature and rainfall. It also reflects the flammability of surface fuels and is commonly used for fire management (see Figure 2 below);
- Soil moisture percentiles – a direct measure of how much water is retained in the soil compared to long-term conditions. Soil moisture is essential for agriculture, vegetation health, and ecosystem resilience (see Figure 3 below); and
Total annual precipitation – tracks overall rainfall trends, which are a key input for drought but must be considered alongside evaporation and temperature to understand drought risk fully (see Figure 4 below).
Figure 2 – Annual mean Keetch-Byram Drought Index (KBDI) drought index value normalised on a scale of 0-10, where 10 is the maximum drought possible
(Values are 20-year averages for present day climate and change for future climate under the RCP4.5 scenario)
Figure 3 – Annual mean soil moisture percentiles; values are calculated relative to present day climate, hence the 50% values for present day. Low values at 2070 are indicative of a drying landscape
(Values are 20-year averages for present day climate and change for future climate under the RCP4.5 scenario)
Figure 4 – Total annual precipitation in mm per year
(Values are 20-year averages for present day climate and change for future climate under the RCP4.5 scenario)
These indicators are derived from climate model simulations using 20-year averages for present-day and future scenarios under RCP4.5. Together, they provide a fuller picture of both short-term and long-term drought potential, capturing the interplay between rainfall, heat, and water retention in the landscape.
Key Findings:
- Inland LGAs are more exposed and susceptible to drought, especially Hilltops;
- Under future climate, by 2070, the magnitude of drought will increase across the Council area as soil moisture declines by 2070, with the greatest impact occurring during the winter and spring; and
- Changes in total annual rainfall are less than the projected changes in soil moisture and drought, suggesting that the increase in drought is being driven primarily by increasing temperatures and their effect on evapotranspiration.

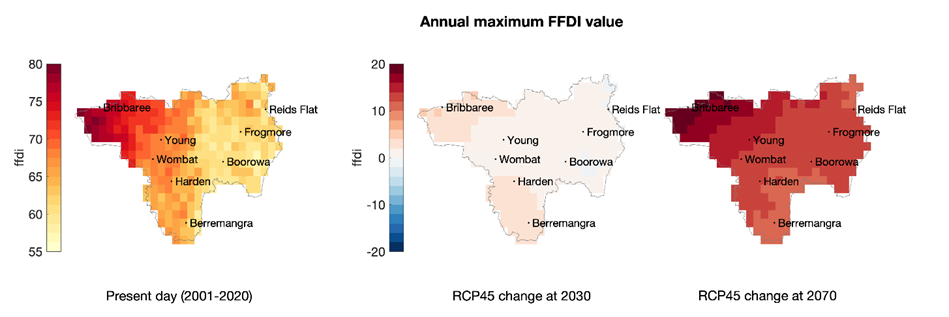
Bush and grassfire – measured by the annual maximum Forest Fire Danger Index (FFDI)
Bushfires and grassfires are among the most dangerous and disruptive climate-related hazards in South-East NSW Region. The annual maximum Forest Fire Danger Index (FFDI) is the nationally recognised measure for assessing bushfire danger and is widely used by emergency services to guide fire warnings, restrictions, and preparedness. FFDI is a composite index that incorporates temperature, wind speed, humidity, and recent rainfall to estimate how dangerous fire weather is on a given day.
This analysis undertaken by Risk Frontiers in 2021 used 20-year averages from historical reanalysis data and future climate projections under the RCP4.5 scenario (see Figure 5 below). This indicator helps identify trends in both the severity and seasonal timing of fire weather across the LGA.
Figure 5 – Magnitude of bushfire weather severity as represented by the annual maximum FFDI
(Values are 20-year averages for present day climate and change for future climate under the RCP4.5 scenario)
Key Findings:
- The frequency of dangerous bushfire weather days and the magnitude of bushfire weather extremes will increase in the Council area; and
- The largest changes for bushfire weather across southeast Australia are expected to be occurring during the spring, with a projected earlier onset of the bushfire season under a warmer climate.

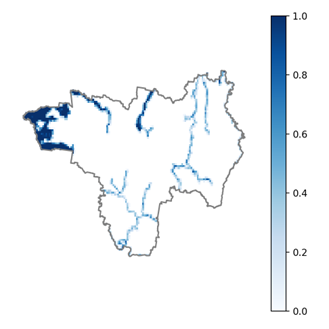
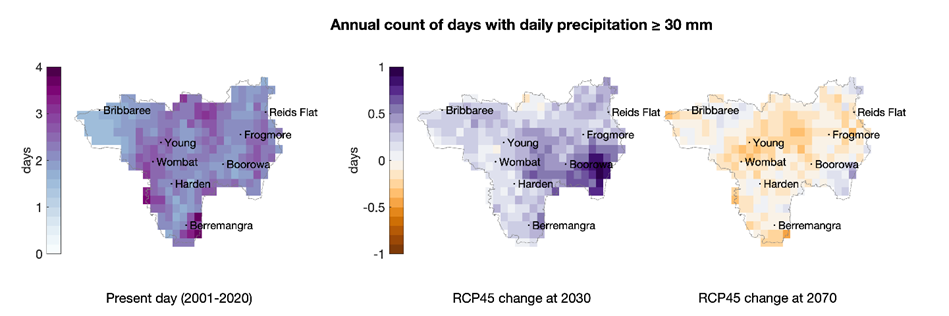
Extreme rainfall and flooding – measured by precipitation over 30mm
Flooding poses a significant hazard to infrastructure, communities, and emergency services. This analysis uses the frequency of very heavy rainfall days (daily rainfall greater than 30mm) as an indicator of flood risk. This threshold (i.e., days with more than 30mm of rain often) is a recognised benchmark in climate and hydrological studies to identify rainfall events that can overwhelm stormwater systems, trigger flash flooding, and lead to significant overland flow.
Projections done by Risk Frontiers in 2021 compared 20-year averages for present day conditions with those for 2030 and 2070 under the RCP4.5 scenario (see Figure 6 below). This helps to understand how the intensity of rainfall events changes, which is crucial for flood management, infrastructure design, and emergency planning.
Figure 6 – Frequency of very heavy rainfall days (>30mm)
(Values are 20-year averages for present day climate and change for future climate under the RCP4.5 scenario)
Key Findings:
- The primary driver of year-to-year variability in rainfall will continue to be the tropical climate drivers of Indian Ocean Dipole (IOD), El Niño Southern Oscillation (ENSO) and the Inter-decadal Pacific Oscillation (IPO). Projections for Pacific climate are indicating an increase in ENSO amplitude, meaning both El Niño and La Niña events will be stronger;
- Extreme rainfall events will produce higher rainfall totals due to the physical relationship between a warmer temperatures and higher atmospheric moisture capacity; and
- Higher rainfall totals may lead to higher flood levels during flooding events, but the frequency of these events will not differ significantly from present.

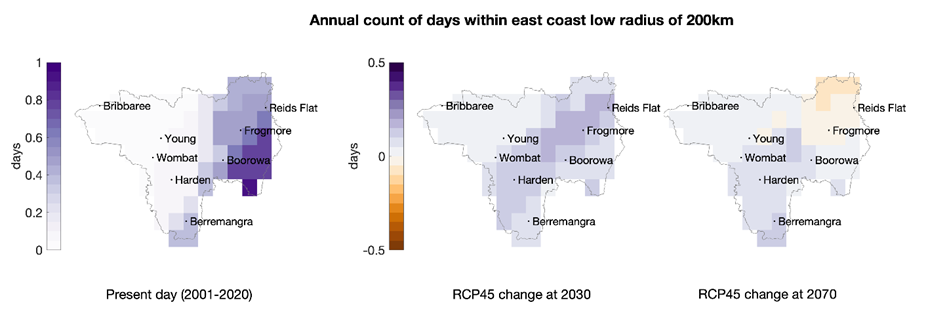
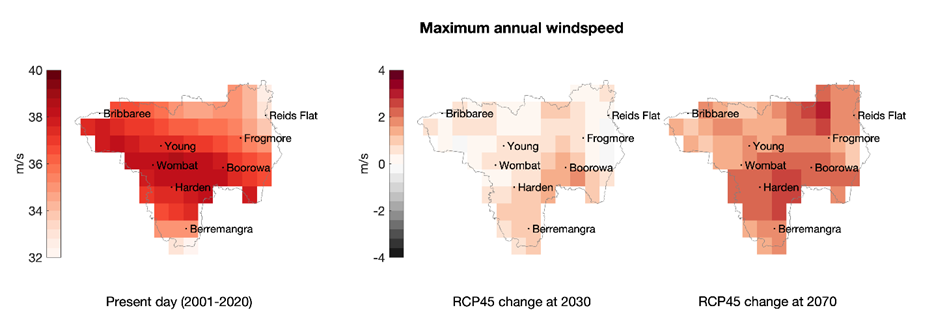
Severe storm, wind and hail – measured by East Coast Low (ECL) days and annual windspeed
Severe storms, ranging from East Coast Lows to thunderstorms and hail events, pose a recurring hazard to communities and infrastructure. This analysis uses two key indicators to evaluate storm-related risk under a changing climate:
- frequency of East Coast Low (ECL) days – ECLs are among the most damaging storm systems affecting the region, often associated with extreme winds, heavy rainfall, large waves, and coastal erosion. Tracking their frequency is important for understanding long-term storm risks (see Figure 7 below).
- annual maximum windspeed – is used to assess the strength of storm systems and frontal weather events that can bring down trees, damage infrastructure, and increase fire danger (see Figure 8below).
Figure 7 – Frequency of east coast low days
(Values are 20-year averages for present day climate and change for future climate under the RCP4.5 scenario)
Figure 8 – Annual maximum windspeed (km/hr)
(Values are averaged across each LGA and calculated as 20-year averages for present day climate and change for future climate under the RCP4.5 scenario—windspeeds at individual locations and years will be significantly higher than the averages.)
Key Findings:
- Under present day climate, the Council area is exposed to several types of storms, including east coast lows (ECL), extra-tropical lows, fronts, snowstorms, thunderstorms, and hailstorms.
- ECL are one of the most damaging storm types to impact the Council area. ECL frequency is expected to increase slightly under future climate which is consistent with an expectation of increased large scale interactions between warm and cool air masses as the climate warms.
- Extratropical lows and associated fronts and thunderstorms can cause significant risk, especially during summertime when they are a primary cause of dangerous bushfire weather.
- Maximum annual windspeed is projected to increase across the Council area, suggesting an increase in the strength of frontal systems.
NARCLiM 2.0 Climate projections
In 2022 NARCliM 2.0 climate data was publicly released – this is the most up-to-date regional climate modelling available for NSW and ACT and is used Government planning, assessments, and strategies.
Table 2 below describes the anticipated future climate projections specific to the Goulburn LGA Hilltops Shire based on NARCLiM 2.0 RCP4.5 (medium emissions) and RCP8.5 (high emissions) scenarios.
This information can also be viewed through an interactive climate change projection map via https://www.climatechange.environment.nsw.gov.au/projections-map
Table 2 – NARCLiM 2.0 Emissions Scenario projections – Hilltops
Risk Exposure Summary
Risk exposure is the degree to which people, places, or assets are at risk from hazards.
The Hilltops Local Strategic Planning Statement and the South Eastern Regional Emergency Management Plan40 has identified the following hazards as having risk of causing loss of life, property, utilities, services and/or the community’s ability to function within its normal capacity:
|
|
|
In 2024, the State Disaster Mitigation Plan identifies these additional 3 hazards having the same risk to life and property:
- Coastal hazard (erosion and inundation)
- Storms and cyclones, and
- Tsunami
The climate modelling performed by Risk Frontiers in 2021 as part of the Resilience Blueprint found that Hilltops has:
- low/moderate flood hazard risk with 8.61% of the land within a modelled floodplain. This is particularly concentrated to the north western boundary (Figure 9)
- moderate bush and grassfire hazard risk with a modelled annual burning probability of 1.47%. This risk area is largely confined to the environment protection and rural zones (Figure 10).
Figure 9 – Hilltops Flood Hazard Index
A dark blue indicates a flood plain, the lighter colour out of it.
The flood hazard index uses a map of modelled flood plains identified by several geographical/geospatial variables including different river types, river stream order, distance to river network, land cover, soil type, average slopes in known flood areas, relative changes in elevation near rivers, and river basin characteristics.
Figure 10 – Wagga Wagga Flood Hazard Index
Life, Property, Economic and Environmental Loss Risk
Fatalities and life loss
Figure 11 – Hilltops Fatalities from Natural Hazard – Risk Frontier 2021
- The analysis found that in Hilltops, floods have resulted in the most fatalities – 9 fatalities, followed by bushfire (7 fatalities), heatwave (7 fatality), lightning (5 fatality) and gust (1 fatality).
- Despite the above, more lives have been lost as a result of the impacts of disaster events across the Hilltops in the days, weeks, months and years that follow. The physical and mental health toll of events is enormous.
- It also does not capture cascading health issues and fatalities. Data in these regards is difficult to bring together but does not change the reality of the pervasive impact of disasters.
Impact on Property and Infrastructure
Figure 12 Distribution of the Average Annual Loss (AAL) of infrastructure by hazard for Hilltops
In terms of the risks posed to property and infrastructure, Risk Frontiers’ Natural Catastrophe loss models have been used to estimate the financial cost, or Average Annual Loss (AAL) across four key hazards in the Council being bushfire, flood, hailstorm and earthquake. The models evaluated losses for commercial, residential and industrial properties.
Under current conditions, the overall baseline AAL for Hilltops is approximately $9 million and the analysis found that hailstorm is the most significant natural hazard accounting for 59% of the AAL, followed by bushfire (28%) as shown in Figure 12 above.
Future climate projections indicate that the AAL in Hilltops will be driven by fire and flood losses. Losses are projected to increase by 8% for fire and 3% for flood by 2070 under a RCP 4.5 scenario.
Average Annual Loss identified in the State Disaster Mitigation Plan
Additionally, in 2024 the State Disaster Mitigation Plan (SDMP) indicates that the AAL in Hilltops for built environment in 2023 consisted of the following:
- Coastal hazard (erosion and inundation) – Very Low;
- Storms – Low;
- Cyclones – Very Low; and
- Tsunami – Not recorded but noted as a rare event.
Editors note: the SDMP does not include specific AAL per LGA. It is colour coded on a scale from $0m to $112m.
Environmental Loss Risk
Risks to threatened flora, fauna and ecological communities from fire and flood were analysed using the following values:
|
|
|
The fire and flood indices were overlaid with an exposure index locating threatened flora, fauna and ecosystems along with agricultural lands. The analysis found that there are:
- Fauna exposure is medium. There are 17 different vulnerable animal species in the Council area, of which 9 are vulnerable, 4 are endangered, and 4 are critically endangered.
- Flora exposure is low/moderate. There are 6 different vulnerable plant species in the Council area, of which 3 are vulnerable, and 3 are endangered.
- Ecological community exposure is moderate. There are 3 different vulnerable ecological communities in the Council area, of which 2 are critically endangered and 1 is endangered.
- The analysis also that the natural environment encompasses 64% of the Shire (0.92% of which is protected), 67.86% devoted to agriculture and farming and the remaining 19.5% is developed built environment.
The total maximum above ground biomass (indicating the potential vegetation density the LGA could support) has 1,126 tonnes of dry matter over the LGA. Overall, Hilltops’s environment has moderate/medium exposure as seen in Figure 13 below.
Figure 13 Hilltops Overall Exposure Index
Agricultural Productivity
There is a correlation between agricultural productivity and climate parameters representing temperature and hydroclimate variability. Productivity of sheep, beef and cropping operations tends to be higher during years that are wetter and cooler with retained soil moisture and low risk of drought. This correlation is particularly apparent for cropping and sheep operations, but a similar, yet weaker correlation can be seen for beef cattle operations as shown in Figure 14 below.
While there are no significant changes for rainfall, worsening drought conditions associated with warming temperatures will directly lead to lower overall soil moisture as seen in Table 1. A projected decrease in soil moisture from a warmer climate may impact agricultural productivity in Hilltops.
Vulnerability and Capacity
Resilience is generally regarded as a function of the intersection of relative exposure, social vulnerability and community capacity:
- Relative exposure is a function of hazard, describing the frequency and magnitude of natural hazard events and capturing the compounding effect of multiple hazards (fire and flood for this analysis);
- Physical exposure of a community is determined such that the quantum of exposed people, buildings, essential facilities, industry, and agriculture can be evaluated;
- Social vulnerability is determined by examining socio-economic and demographic factors that may exacerbate or ameliorate the effects of an external threat to a person’s life, livelihood, or assets; and
- Community capacity to resist, avoid and / or adapt to a disaster and to use these abilities to create security either before or after a disaster can be determined by examining several factors.
For each of these measurement framework indicators, an index has been produced by a weighted average of each metric contributing to the category. An analysis of the measurement framework indicators for each Statistical Area 1 (SA1) across South East NSW culminates as an integrated index of resilience; Figure 15 and Figure 16 below shows community resilience indices for Hilltops.
In Hilltops:
- the mean relative exposure component of the resilience index is high for bush/grass fire and high/extremely high for flood (see Figure 17 and Figure 18 below);
- There are no SA1s scoring low to extremely low for the relative exposure component or resilience to either bush/grass fire or flood;
- The Council area’s mean social vulnerability score is low average. 31.6% of the population reside in SA1s scoring low or worse for the social vulnerability component of resilience (see Figure 19 below); and
- The mean community capacity component of the resilience index is average for both bush/grass fire and for flood. 8.9% of the population reside in SA1s scoring low or worse for the community capacity component of resilience to flood and 14.4% reside in SA1s scoring low or worse for the community capacity component of resilience to bush/grass fire (see Figure 20 and Figure 21 below).
Gaps in Data
This local profile draws on a range of demographic, hazard, and climate data. However, key data gaps remain that affect the LGA’s ability to fully understand, plan for, and reduce disaster risk. These include:
- Community preparedness and capacity indicators: The LGA does not currently have access to survey or community feedback data measuring preparedness levels, access to emergency information, or volunteer participation in response agencies.
- Historical event records for compound hazards: Although Council holds data on specific floods, less is documented on historical hailstorms, snow impacts, or cascading hazards (e.g., fire following drought). A central repository of multi-hazard historical events would aid scenario planning.
- Economic disruption and recovery data: The financial impact of disasters on local businesses, agricultural output, and service continuity is not systematically tracked. This limits the ability to prioritise support for economic recovery.
- Infrastructure interdependency data: There is limited modelling available on how disruptions in infrastructure (e.g., water treatment, power supply, road access) might amplify vulnerability during hazard events, particularly for small towns and villages reliant on single corridors.
- Monitoring and evaluation frameworks: Council currently lacks a formal framework for tracking progress on disaster risk reduction and climate adaptation goals. Without this, it is difficult to evaluate the impact of initiatives over time.
- Limited integration of hazard overlays into planning controls: Although hazard data exists, it is unclear to what extent it has been embedded in Hilltops’ LEP, DCP, or growth management strategies to guide future development away from high-risk areas.
Reference
- Hilltops Council, 2025, The Hilltops LGA and Region. Available online at https://www.hilltops.nsw.gov.au/council/the-hilltops-lga-and-region/
- Ibid
- idcommunity, 2024, Hilltops Council area Community Profile. Available at https://profile.id.com.au/hilltops/home
- idcommunity, 2021, Hilltops Council area Population and dwellings. Available at https://profile.id.com.au/hilltops/population
- Ibid
- Ibid
- idcommunity, 2021, Hilltops Council area Five-year age groups. Available at https://profile.id.com.au/hilltops/five-year-age-groups
- Ibid
- idcommunity, 2021, Hilltops Council area Need for assistance. Available at https://profile.id.com.au/hilltops/assistance
- idcommunity, 2021, Hilltops Council area Language used at home. Available at https://profile.id.com.au/hilltops/language
- Ibid
- Hilltops Council, 2020, Local Strategic Planning Statement. Available online at https://www.hilltops.nsw.gov.au/develop/strategic-land-use-planning/
- idcommunity, 2021, Hilltops Council area: Value added. Available online at https://economy.id.com.au/hilltops/value-add-by-industry
- idcommunity, 2021, Hilltops Council area: Employment by industry https://economy.id.com.au/hilltops/employment-by-industry
- idcommunity, 2021, Hilltops Council area: Worker productivity. Available at https://economy.id.com.au/hilltops/worker-productivity-by-industry
- idcommunity, 2021, Hilltops Council area: Gross Regional Product. Available at https://economy.id.com.au/hilltops/gross-product
- idcommunity, 2021, Hilltops Council area Population and dwellings. Available at https://profile.id.com.au/hilltops/population’
- .idcommunity 2022
- Hilltops Council, 2020, Local Strategic Planning Statement. Available online at https://www.hilltops.nsw.gov.au/develop/strategic-land-use-planning/
- South West Slopes Bush Fire Management Committee, 2023, Bush Fire Risk Management Plan – Planning Together. Available online at https://www.rfs.nsw.gov.au/__data/assets/pdf_file/0011/259148/South-West-Slopes-BFMC-BFRMP.pdf
- Hilltops Council, 2020, Local Strategic Planning Statement. Available online at https://www.hilltops.nsw.gov.au/wp-content/uploads/2021/12/HilltopCouncilLocalStrategicPlanningStatement2020.pdf
- Hilltops Council, 2022, Community Strategic Plan. Available online at https://shared-drupal-s3fs.s3-ap-southeast-2.amazonaws.com/master-test/fapub_pdf/Local+Strategic+Planning+Statements/LSPS+regional+2020/Hilltop+Council+Local+Strategic+Planning+Statement+2020.pdf
- NSW SES, 2025, Local Flood Insights: Murrumbidgee River. Available online at https://storymaps.arcgis.com/stories/50dbc33dddcb444b9e3c526342cfc32d
- Lyall & Associates and Nexus Environmental Planning Pty Ltd, 2015, The Town of Young Floodplain Risk Management Study and Plan. Available online at https://www.hilltops.nsw.gov.au/wp-content/uploads/2021/07/Volume-1-Report-Nov-2015-Rev-1-4-1.pdf
- Lyall & Associates and Nexus Environmental Planning Pty Ltd, 2018, Boorowa Floodplain Risk Management Study and Plan. Available online at https://www.hilltops.nsw.gov.au/wp-content/uploads/2021/07/BFS_Vol_1_Report-Rev-1-2-FINAL-1.pdf
- WMA Water, 2011, Jugiong – Floodplain Management Study and Plan. Available online at https://www.hilltops.nsw.gov.au/wp-content/uploads/2021/07/Jugiong-flood-study.pdf
- WMA Water, 2020, Marrumburrah Flood Study. Available online at https://www.hilltops.nsw.gov.au/wp-content/uploads/2021/07/Murrumburrah-Flood-Study-Report-Final-Vol1.pdf
- Ibid.
- Hilltops Council, 2020, Local Strategic Planning Statement. Available online at https://www.hilltops.nsw.gov.au/wp-content/uploads/2021/12/HilltopCouncilLocalStrategicPlanningStatement2020.pdf
- Ibid.
- Hilltops Council, 2024, Media Release – 18 July 2024 – Community Update on Young Stormwater Trunk Main Project. Available online at https://www.hilltops.nsw.gov.au/media-release-18-july-2024-community-update-on-young-stormwater-trunk-main-project/
- Hilltops Council, 2025, Councillor Column – 11 February 2025 – Mayor Brian Ingram. Available online at https://www.hilltops.nsw.gov.au/councillor-column-11-february-2025-mayor-brian-ingram/
- The Hilltops Phoenix, 2025, Harden Hit By Huge Hailstorm.
- Hilltops Council, 2020, Local Strategic Planning Statement. Available online at https://www.hilltops.nsw.gov.au/wp-content/uploads/2021/12/HilltopCouncilLocalStrategicPlanningStatement2020.pdf
- Ibid.
- [1] NSW Reconstruction Authority, 2024, State Disaster Mitigation Plan 2024-2026. Available online https://www.nsw.gov.au/sites/default/files/noindex/2024-02/State_Disaster_Mitigation_Plan_Full_Version_0.pdf
- Hilltops Council, 2022, Community Strategic Plan. Available online at https://shared-drupal-s3fs.s3-ap-southeast-2.amazonaws.com/master-test/fapub_pdf/Local+Strategic+Planning+Statements/LSPS+regional+2020/Hilltop+Council+Local+Strategic+Planning+Statement+2020.pdf
- NSW Government, 2021, South Eastern Regional Emergency Management Plan. Available online at https://www.nsw.gov.au/sites/default/files/2023-10/SE_Region_EMPLAN_2021_removed.pdf
- South Eastern Regional Emergency Management Committee, 2021, South Eastern Emergency Management Plan (updated October 2023). Available online at https://www.nsw.gov.au/sites/default/files/noindex/2023-10/South_East_Region_EMPLAN_v2.1.pdf


