
Home » Resilience Assessment
Resilience Assessment
The Resilience Assessment for the South East sets about defining our region through our landscapes, people, and places. It assists us to define what risks are and what risks we face in our region including shocks and stresses and details our exposure and vulnerability. It shows us what to expect from a changing climate looking at the present, and predictions for 2030 and 2070.
COAST
ALPINE SLOPES
TABLELANDS
Our Landscapes, People and Places
Understanding Risk
Our Risks in South East NSW
Risks in a Changing Climate
Our Landscapes, People and Places
A key element of how we identify ourselves and our values stems from where and how we live, the characteristics by which our varied communities across South East NSW have formed and continue to thrive.
The Blueprint spans 11 local government areas including Bega Valley, Eurobodalla,Goulburn-Mulwaree, Hilltops,Queanbeyan-Palerang, Snowy Monaro, Snowy Valleys, Upper Lachlan, Wagga, Wagga, Wingecarribee and Yass. Our region is centredaround the nation’s capital of Canberra which itself is home over 400,000 people.Opportunities for collaboration across borders, not only with Canberra but Victoria to the south, have and continue to be fundamental to many aspects of how we live, work and play.
Our Landscapes
First Nations Australians were the first inhabitants of the region, and maintain enduring deep spiritual, cultural and physically connection with Country. The South East and Tablelands Region spans the coastline from Durras Lake near Batemans Bay to the Victorian border.
The south-eastern corner of NSW is home to Australia’s highest summits, including Mount Kosciuszko and Mount Townsend, and the headwaters of the Snowy, Murray, Murrumbidgee and Lachlan rivers. Well known for its beaches, the South East and Tablelands Region includes enclosed beach compartments as well as large coastal embayments such as Batemans Bay. It stretches inland, taking in Wagga Wagga which forms the most eastern part of the Riverina district and is NSW’s largest inland city (AdaptNSW, 2014).
The region’s landscapes have different ecological and productive characteristics which over time, have driven where and how our townships and economic activities have developed since European settlement. South East NSW is popularly known for its diverse landscapes which are influenced by their unique land formations, geologies and climates.
Today, the picturesque natural environments, pristine waterways and clean air within these landscapes attract residents and visitors alike, drawn by access rugged bushland, mountain hiking, coastal adventures, inviting and unique rural towns and great weather. Communities across the South East region are passionate about protecting the natural environment and its landscapes, volunteering their time to help preserve them.
Kosciuszko National Park is NSW’s largest national park and home to Australia’s highest peak, Mount Kosciuszko. Mount Kosciuszko is renowned for its world-class ski resorts, ghostly snow gums and the famous summit walk to the highest point in Australia.
Yarrangobilly Caves is at the northern end of the national park. Its limestone dates back 440 million years (Visit NSW, 2022). The alpine ecosystem is home to unique biodiversity and is a haven for threatened species.
Tall old-growth forests, waterfalls and escarpments are dotted throughout the national parks of the Sapphire Coast, with mixed ecosystems protected across nature reserves, state forests and national parks to the west through the Snowy Valleys. The region’s landscape importantly underpins aspects of First Nations cultural heritage connection with protected features such as Lake George sand deposits, Gulaga and Biamanga national parks, remnant vegetation within roadside corridors and travelling stock reserves (NSW Government, 2017).
The southern tablelands and south-eastern slopes contains many temperate grassland, woodland, wet forest and alpine ecosystems, and plant and animal species not found elsewhere in NSW. There are internationally significant (Ramsar) wetlands such as Blue Lake in the Snowy Mountains. Significant protected areas include Kosciuszko National Park, the South East Forests and Deua-Wadbilliga national parks on the escarpment, and Nadgee Nature Reserve on the far south coast. The state’s only pristine estuary, Nadgee Inlet, is located in the region. These biodiversity hotspots are also significant cultural landscapes for the region’s First Nations peoples (AdaptNSW, 2014).
The topography of the South East NSW region results in a large range of climates. It is relatively wet close to the coast and Snowy Mountains, and drier inland. It is hot in summer in northern inland areas and very cold in winter in the Snowy Mountains. Milder conditions are found along the coast, with cooler temperatures in summer and warmer temperatures in winter (AdaptNSW, 2014).
Our People

In 2021 the Aboriginal and Torres Strait Islander population was estimated at 4 per cent of the region’s population, an increase of 2,816 people from the 2016 Census estimate data.
The region’s 11 LGAs accommodated an estimated population of is 373,533 residents in 2021, an increase of 25,244 people or 9 per cent since 20161. This is consistent with a general regional migration shift as a result of the COVID-19 global pandemic.
Across the region, with the exception of Wagga Wagga, the largest changes in the age structure between 2016 and 2021 were in the following age groups:
- 8,880 more seniors (70 to 84)
- 5,199 increase in young workforce (25 to 34)
- 3,478 additional empty nesters and retirees (60 to 69)
- 1,752 more parents and homebuilders (35 to 49) (.id community 2022).
The region continues to experience a lower proportion of people in the younger age groups (0 to 17 years) compared to wider regional NSW (.id community 2022).
13 per cent of the population were born overseas and 6 per cent spoke a language other than English at home in 2016. The largest changes in the spoken languages of the population in the region between 2011 and 2016 were for those speaking Mandarin, Punjabi, Nepali and Filipino / Tagalog. However, the top three languages spoken in the region in 2016 were Italian, German and Macedonian (.id community 2022).
The CRJO region’s land area of 63,319km2 accommodates 148,336 dwellings with an average household size of 2.39. In 2021, 69 per cent of households were purchasing or fully owned their home, 19.1 per cent were renting privately, and 2.7 per cent lived in social housing. The total number of households in the region increased by 11,546 between 2016 and 2021, most of which were purchasing or fully owned their home (.id community 2022).
The largest household type in the region is couples without children, at 29.7 per cent, and couples with children at 24.9 per cent. However the largest changes in family / household types in the region between 2016 and 2021 were couples without children (+4,194 households) and lone person (+3,208 households) (.id community 2022).
In 2021, 18,208 people (or 5.9 per cent of the population) in the region reported needing help in their day-to-day lives due to disability, which is a similar percentage to 2016. 36.7 per cent of the population reported to have at least one long-term health condition, with the top conditions being arthritis, a mental health condition and asthma.
The region’s community strategic plan notes some social issues in the region include building community cohesion and connection, ensuring that diversity and inclusion are fostered, including the recognition of First Nations people, and mitigating the impact of alcohol, other drugs and crime. Key aspirations for communities across South East NSW relate to:
- retaining the rural character of settlements
- coping with population growth
- housing availability and affordability
- retaining and support young people
- ensuring the right services and infrastructure is in place to cater to cohorts such as older people (CRJO, 2021).
The region’s population is projected to increase, with particular increases in places within commuting distance of Canberra and Sydney, in strategic centres and along the coast (NSW Government, 2017).


Our Values
Individuals and community
The Resilience Blueprint engagement program included community workshops, targeted discussions and an online survey involving all 11 LGAs. Thousands of participants from different walks of life contributed to the dialogue across different age groups, gender identification, sexual orientation, employment status and physical and mental abilities. Feeling safe is a key value for individuals and communities. This extends to looking out for vulnerable neighbours with physical and mental disabilities, and ensuring multicultural approaches are inclusive of the entire community and their needs.
Self-sufficiency is valued. To aid this, information is needed, along with a plan. The community is not powerless in picking itself up from adversity.
Retention of biodiversity and ecosystem values, with a focus on supporting Indigenous practices to care for Country, is important. Valuing the ability to ‘do our bit’ is strong, which means figuring out how to be adaptive and being careful about what we can and cannot rely on at times.


First Nations
Resilience is inherent to Australia’s First Nations people. Across 29 discussions with First Nations people, there is strong awareness the climate is changing and that Country is enduring significant impact from human impact. ‘The plants, animals, water and fish tell us’, Country provides these indicators for us all.
Cultural burning practices should be immediately embedded in the care of Country and be standard practice in Australia. This will require employment and training of First Nations people across a whole range of related areas. It is a necessity, not a trend.
First Nations People should have a greater place in decision-making processes.
Creating space for yarning and truth telling, where opportunities for discussions on preparation for climate-based events is encouraged.
Youth
Conversations with 43 youth participants across the region to inform the Resilience Blueprint highlights strong values associated with the protection of family, community, natural habitat, wildlife and ecosystems. Culture and places of cultural significance, health, income, renewable energy and infrastructure are also passionate topics.
Connection with Country, engaged communities, climate change and sustainability are key aspects of focus for the region’s youth.
Our Places
Our places and townships form the basis for our social, economic and service needs interactions. Major cities in the region are Goulburn, Queanbeyan and Wagga Wagga with regional centres including Bega, Yass, Cooma, Young and Batemans Bay. These centres are supported by many unique local centres and townships.
The combination of landscapes, economic productivity and human settlements create and attract different social, cultural, community and economic qualities. These elements and their interactions represent the concept of ‘place’ which forms a key part of how we identify ourselves and our sense of belonging.
The region’s heritage builds on a long Indigenous history which continues today. Following European colonisation, the region’s agricultural heritage provided the foundation for the emergence of vibrant townships and communities which remains its largest industry. The region’s history is embodied by protected heritage buildings and Aboriginal cultural heritage sites, connecting today and tomorrow with the past.
The scale of the region is spanned by an extensive state and local road networks, rail, air and travelling stock route networks. Coastal areas of the region also accommodate fishing, tourist and freight ports and recreational marinas. The Port of Eden in Bega Valley and Bateman’s Bay in Eurobodalla are key locations which support diverse marine industries.
Because of the scale of the area and distances between centres, a high level of car dependence exists. Access to shared and public transportation services remains challenging across rural areas. However, active travel is supported by rail trail networks, walking and cycling networks and mountain bike tracks. While facilities differ across communities, the region in general offers a variety of facilities with libraries, sports facilities, community halls, emergency services, medical facilities and services, and aquatic centres. These assets underpin the social fabric of the places we call home. They also serve important roles before, during and after emergency events.
The region’s general proximity to Canberra and Sydney has cemented its attraction for those who can access flexible and remote working arrangements. Local employment opportunities within the region and the recruitment and retention of a skilled workforce is an ongoing and crucial challenge. Housing availability plays a key role, with periods of housing stress contributing to dynamic economic and social circumstances across parts of the region, with many remaining in economic and social recovery from previous disaster events and as a result of the COVID-19 global pandemic.
In 2021, the region’s Gross Regional Product was $14.81 billion, which was almost a 2 per cent increase following a decline in 2020 as a result of COVID-19 impacts (NIEIR, 2021). The region supports an estimated 110,311 local jobs and 29,698 local businesses with the predominate industries being:
- agriculture, forestry, and fishing (6,296 registered businesses)
- construction (5,898 registered businesses)
- professional, scientific and technical services (2,975 registered businesses)
- rental, hiring, and real estate services (2,306 registered businesses) (.id community 2022).
The region’s broad nature-based tourism industries, which include snow sports, mountain biking, surfing and bushwalking, attract increasing numbers of domestic and international visitors. The region is also known for its renewable energy supply in terms of wind, solar, and hydropower which is fast growing the economic revenue for the region as part of the transition from coal production and mineral mining (NSW Government, 2017).
The South East and Tablelands Regional Plan 2036 predicts the Port of Eden and Canberra Airport will enhance access to national and international markets, while more diverse tourism opportunities in the Snowy Mountains will strengthen long-term economic resilience in the face of changing snow seasons into the future.
In terms of agriculture, the top contributors in the region include beef cattle, broadacre crops, horticulture, viticulture, cultivated turf, poultry, sheep, lamb, wool and dairy. Value-add agricultural opportunities from stone fruit supply and cheese production are gaining popularity amongst small-scale producers and consequently support commercial, tourism and recreational activities (NSW Government, 2017 and Department of Primary Industries (DPI), 2020).
Livestock grazing in the region occupies approximately 50 per cent of agricultural land (DPI, 2020). The region is also known for its cherry and seed potato production.
Major projects in the region include Snowy Hydro 2.0, Inland Rail, multiple wind farms, the Wagga Wagga and Snowy Mountains Special Activation Precincts and several water storage and security projects. Rebuilding following the 2019-20 Black Summer bushfires remains a particular focus across the region.
Major national telecommunications and electricity corridors and infrastructure traverse the region, connecting the east coast of Australia.
Understanding Risk
How we navigate resilience requires us to first consider a range of contributing elements.
Shocks and Stresses
Resilience is ultimately put to the test through the impact of acute shocks and chronic stresses that communities may experience. Acute shocks are typically sudden onset events such as floods, bushfires, heatwaves, earthquakes and disease. Chronic stresses are factors that place pressure on communities on a daily, frequent or reoccurring basis such as drought, high unemployment, weed and pest outbreaks, ageing populations and housing availability (Resilient Cities Network, 2015).
Resilience can be considered as the ability of a community or system to continue to aspire to sustainable development goals, even when stresses and shocks occur.
Importantly, we must remain aware that chronic stresses can amplify the impact of events, and chronic stresses are apparent at all times across all communities to different extents. The more effort it takes for communities to deal day-in-day-out under stress, the less ‘reserve capacity’ we have when a shock occurs.
Risk Exposure, Vulnerability and Tolerability
The concept of resilience, and the characteristics which define resilience, is tied to risk and vulnerability. However, it is important to keep in mind that risk and vulnerability assessment processes do not necessarily tell the entire tale about a community’s level of resilience.
Understanding risk is a function of analysing the hazards that exist, the nature of what is exposed, and any vulnerabilities that multiply or amplify the potential impact of a hazard. Tolerability is a further consideration, which considers certain resilience measures employed to help people, systems, buildings and infrastructure assets and networks to withstand a certain level of hazard impact.
The Intergovernmental Panel on Climate Change (IPCC) (2020) defines risk as:
‘the potential for adverse consequences for human or ecological systems, recognising the diversity of values and objectives associated with such systems’.
Identifying and understanding risks requires the consideration of the multiplying effects of:

In the 2018 publication ‘Profiling Australia’s Vulnerability’, it is noted that:
‘hazards only lead to disaster if they intersect with an exposed and vulnerable society and then the consequences exceed its capacity to cope. Vulnerability arises from the relationships that we have with the things we value (people, places, objects, critical services, emergency services, etc.) and how these things may be disrupted as a result of an emergency or crisis. Vulnerability also arises from the tensions and trade-offs we have to make about where to allocate limited time, effort and money in disaster preparation, response or risk reduction to protect those things of value’ (National Resilience Taskforce, 2018).
Our tolerance to risk can vary and is dependent on many factors and circumstances. It is a function of the risk we are willing to tolerate or accept.
Risk is inherently a function of the consideration of:
- the probability or likelihood of a hazard occurring
- the elements (values and assets) exposed to the hazard
- aspects of vulnerability and sensitivity
- degree of consequence or impact.
Our capabilities to address risk and deploy risk management processes and approaches can help to avoid, mitigate or minimise risk probability, exposure, vulnerability or consequence.
A focus on resilience helps us to take a systems-based approach through everything we do to contemplate risk, extending beyond the parameters of emergency management to consider how we can make better informed decisions in anticipation of natural hazard events and other shocks and stresses on our communities.
With a changing climate we should protect the environment around us and the people in the community. For natural hazards, we should protect the animals and the people and the food so then we can survive. Bega Valley Shire resident, 15 year old

Our Risks in South East NSW
South East NSW is not a stranger to risks or disaster events. Over recent years we have endured one of the worst droughts in NSW recorded history which led into the 2019-20 Black Summer bushfires. Within months, the COVID-19 global pandemic not only causedwidespread disruption but impacted and prolonged drought and bushfire recovery efforts.
We have been at the epicentre of some of Australia’s worst disasters. This includes the devastating 1997 Thredbo landslide, 2003 Canberra bushfires, 2018 Tathra bushfire and 2016 east coast low. In 1860, heavy rainfall in the Araluen and Braidwood area lead to severe flooding, claiming the lives of 24 people as one of the earliest records of major loss in the region.
The region is susceptible to bushfire, hailstorms and other severe storms, flooding, coastal hazards, drought, heatwaves and landslips. Extreme heat and heatwave is a particularly silent and invisible threat, one that is projected to rise across South East NSW between now and 2070 as a result of climate change.
How we continue to build resilience to risks and their cascading impacts requires us to understand and be aware of the risks that we face.

Figure 4 – Risk Frontiers resilience measurement framework for South East NSW
Resilience is generally regarded as a function of the intersection of relative exposure, social vulnerability and community capacity.
Relative exposure is a function of hazard, describing the frequency and magnitude of natural hazard events and capturing the compounding effect of multiple hazards (fire and flood for this analysis). Where a community is subject to both fire and flood, it is potentially less resilient than one exposed to a single hazard of the same frequency and magnitude.
The physical exposure of a community is determined such that the quantum of exposed people, buildings, essential facilities, industry, and agriculture can be evaluated. The physical vulnerability of exposed elements is also important, such as the age and construction type of buildings (for example, buildings with raised floors are more resilient to flood as they provide greater protection to the occupants and their belongings, resulting in less loss of life and property).
Social vulnerability is determined by examining socio-economic and demographic factors that may exacerbate or ameliorate the effects of an external threat to a person’s life, livelihood, or assets. Examples of these types of indicators include age, occupation, health status, income and education.
Community capacity to resist, avoid and / or adapt to a disaster and to use these abilities to create security either before or after a disaster can be determined by examining several factors such as:
- the level of social wellbeing and community connectedness – often measured by the number of volunteers in a community and the availability of community facilities, knowledge, and experience of disasters (which improves community awareness and preparedness)
- self-protection – for example the availability of emergency services, structural protections or land management activities
- social protection and governance – including community organisations and diversity of employment in a community, which contributes to financial capacity.
Within each of the measurement framework indicators, an index has been produced by a weighted average of each metric contributing to the category. An analysis of the measurement framework indicators for each Statistical Area 1 (SA1) across South East NSW culminates as an integrated index of resilience, refer to the figure of community resilience indices.


Figure 5 – Community resilience indices for Statistical Area Level 1 (SA1) across South East NSW

Hazards
A hazard is a natural process or occurrence, a source event which has the potential to result in harm or cause loss or damage depending on exposure. The United Nations Office for Disaster Risk Reduction (2020) provides a classification of hazard types to include:

Meteorological and hydrological - tropical cyclones, lows and troughs, drought, floods and heatwaves.

Extra-terrestrial - asteroid and meteorite impacts or solar flares.

Geohazards - earthquakes, volcanic eruptions, subsidence and landslides, tsunami, rockfalls and sinkholes.

Environmental – bushfires, land salination, reduced snow pack, biodiversity loss, contamination, storm surge and coastal erosion

Chemical – exposure of chemicals to humans, landscapes and ecosystems.

Biological – disease outbreak, epidemics and pandemics

Technological – technology failure and complex systems which can be interrupted across local, national and international scales across a spectrum of interests including economics, security, infrastructure, transport and health. This includes cyber attacks.

Societal – violence, conflict and civil unrest.
Hazards can occur at different frequencies and intensities, not all will generate the same impacts. It depends on the values that are exposed, whether they be people, buildings, infrastructure assets or environmental values or communities. A hazard occurrence on its own may not give rise to significant risk, rather it is the source of the potential for risk.
Whilst we are not immune to all of the hazards described above, the probability of some are extremely low in our region. But this does not mean that global impacts from events elsewhere cannot impact us. The 2022 eruption of Tonga’s Hunga Tonga-Hunga Ha’apai volcano for example resulted in a tsunami warning for Australia’s east coast, with effects felt in Bateman’s Bay, particularly by the oyster industry, and along the NSW coastline.
Some hazards require hazard-specific management efforts and activities, whilst broader environmental, community and economic approaches enables a breadth and depth of baseline attributes that enable us to build resilience to a multitude of potential hazard shocks and stresses.
Probability
Weather and climate events can be acute, such as storm or flood, or chronic such as drought. Due to seasonal climate variability, hazard probability can vary from year to year. For example, during 2019-20 the climate was in an El Nino state and the primary hazards were related to drought, heat and bushfire. Whereas from 2020, the climate shifted to a La Nina phase, so the primary hazards were more related to storms and flooding.
There is also a geographical control on the primary hazard type, with inland locations being more exposed to heat and drought, while coastal locations are more exposed to storm and flood.
Based on current-day probabilities, the frequency of event conditions means the hazards most likely experienced in South East NSW include:

Local and district Emergency Management Plans also identify tsunami and snow-related hazards, including isolation and avalanche, and landslides as possible hazards within the region.
Exposure and Vulnerability
Exposure is related to the assets, facilities and elements of value in a location that are potentially subject to impact from a hazard. This includes people, buildings and infrastructure assets that are located within the floodplain, or within bushfire prone areas for example.
Vulnerability is a measure of the degree to which people and property are susceptible to a hazard or hazards, and their potential level of sensitivity to an impact. Some land uses for example are more vulnerable than others such as aged care facilities, child care centres and schools.
Data by LGA can be found in the Resilience Blueprint LGA snapshots.
Property and Infrastructure
To measure exposure, Risk Frontiers’ Natural Catastrophe loss models have been used to estimate the financial cost for four key hazards in the region being bushfire, flood, hailstorm and earthquake. Losses are evaluated for commercial, residential and industrial property. As such, this data does not represent a full risk-based assessment but enables a consistent view of potential exposure across key assets for each LGA in the region.
Across the region and in terms of Average Annual Loss (AAL) costs, flood and hail are the most significant natural hazards in terms of property, followed by bushfire. From an exposure perspective, there are approximately 257,527 property addresses (as per the Geocoded National Address File or G-NAF) in South East NSW. The exposure value of residential, Commercial and Industrial buildings, contents replacement and business interruption totals around $132 billion.

Figure 6 – Distribution of exposure across South East NSW with the G-NAF count on the left and aggregate exposure values (in billions) for each LGA on the right (Source: Risk Frontiers)
Most losses in South East NSW are likely driven by riverine flood, comprising around 59 per cent of the AAL metric. The main loss driver is not expected to drastically change within the time horizons of this study which are 2030 and 2070. The results show only slight increase in losses for 2030, with more important changes observed for 2070. The share of flood loss is projected to increase moderately but bushfire loss will increase considerably given that bushfire is the primary hazard widely expected to get worse with temperature increases, claiming more of the loss share.

Figure 7 – Distribution of the Average Annual Loss (AAL) of infrastructure by hazard for South East NSW
It must be noted that the models used to estimate AAL are based on current climate change, population, land cover, land use and built environment data inputs. These inputs are dynamic and will change over time, influencing AAL projections moving forward. Asset replacement values will also increase over time. Quantification of exposure and vulnerability resile on data availability which is constrained in some cases. For example, bushfire attack level (BAL) rating for properties and age of asset could not be sourced as part of analysis of risk informing the Blueprint.
For each LGA in the South East, it is clear that bushfire risk will increase in the future in any of the greenhouse gas emissions scenarios that might occur.
Of the hazards examined, riverine flooding is the main loss driver for eight of the LGAs including Bega Valley, Eurobodalla, Goulburn Mulwaree, Queanbeyan-Palerang, Snowy Monaro, Upper Lachlan, Wagga Wagga and Yass. The main loss driver for Hilltops, Snowy Valleys, and Wingecarribee is hail.


Figure 8 – Relative exposure indices for SA1s across South East NSW
Social and Human Health
The most difficult aspect of the reality of risk is that posed to life.
Across South East NSW, thousands of people live in locations that are exposure to one or more natural hazards including some in higher risk circumstances.
From a human health perspective, life loss throughout the region from 1900 to the present day has been analysed using PerilAUS, Risk Frontiers’ database of natural hazard impacts.
Approximately 218 fatalities have occurred due to natural hazards throughout South East NSW from 1900 to June 2022. The natural hazards that have led to loss of life in South East NSW include avalanche, bushfire, flood, wind, hazardous surf, heatwave, landslide and lightning.
Floods have claimed the most lives in the region since 1900, accounting for 45 per cent of natural hazard fatalities, followed by bushfire at 23 per cent, lightning at 12 per cent and landslide at 9 per cent.
If we focus only on the past three decades since 1990 for a better understanding of the more recent hazards occurring across South East NSW, landslides account for the largest proportion of fatalities at 38.3 per cent, followed by bushfire at 25.5 per cent and flood at 21.3 per cent.
Since 1900, the eight most devastating natural hazard events in the region include the 1997 Thredbo landslide, followed by the 2019-20 Black Summer bushfires, the Burrinjuck Dam flood in 1950, the 1904-05 bushfires, the 1939 heatwave, bushfires in 1952, Goulburn flood in 1943 and the Black Friday bushfires of 1939.
The factors which contribute to fatalities and how this has changed over recent decades could be attributed to a number of things. From enhanced communications and early warnings systems, enhanced community participation in emergency management processes, changes in settlement patterns and housing quality, how we prepare for and respond to events is constantly evolving and improving.
Despite the above, many more lives have been lost as a result of the impacts of disaster events across the region in the days, weeks, months and years that follow. The physical and mental health toll of events is enormous. It also does not capture cascading health issues and fatalities. Data in these regards is difficult to bring together but does not change the reality of the pervasive impact of disasters.
From a biological hazard perspective, the COVID-19 global pandemic has brought into sharp focus the risk of disease, epidemics and pandemics and their associated impacts. These include risks to life and health, impacts on public health systems, mental health and the economy.
Social vulnerability is determined by examining socio-economic and demographic factors that may exacerbate or ameliorate the effects of an external threat to a person’s life, livelihood, or assets. This includes indicators of age, occupation, health status, income and education. Community capacity considers the ability to resist, avoid and / or adapt to a disaster and to use these abilities to create security either before or after a disaster through considerations of wellbeing and connection, self-protection activities, social protection and governance.
An analysis of vulnerability and community capacity across South East NSW highlights where opportunities exist to direct particular strategies contained within the Resilience Blueprint directions framework.
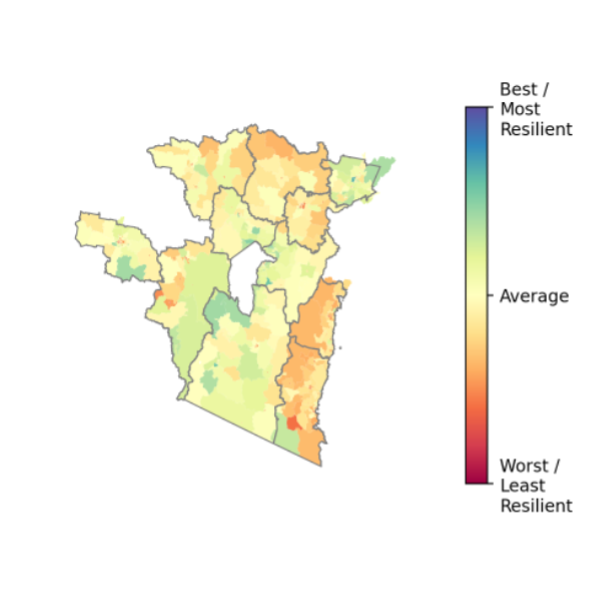
Figure 9 – Social vulnerability index for SA1s across South East NSW
Fire

Flood

Figure 10 – Community capacity indices for SA1s across South East NSW

Natural Environment
Exposure of environmental values has been explored, having regard to:

threatened ecological communities

land use

land cover

protected areas

connectivity

maximum above-ground biomass

fauna, flora and ecological communities

fauna, flora and ecological communities
As part of this environmental risk analysis, hazard frequency indices combining current and future risk have been compiled for fire and flood.

Figure 11 – Individual components of the fire hazard index (a and b) and final index c informing the Blueprint

Figure 12 – Flood hazard index informing the Blueprint
The fire and flood indices are overlaid with an exposure index locating threatened flora, fauna and ecosystems along with agricultural lands.


Figure 13 – Environmental values exposure index
The vulnerability and coping factors of natural environment systems are also considered, having regard to level of protection, connectivity and habitat quality, resulting in risk maps for fire and flood.


Figure 14 – Fire risk (left) and flood risk (rig) for natural environment values at the 1km2 resolution
The region is home to a vast number of vulnerable fauna and flora species. Areas of increased exposure and vulnerability include Goulburn Mulwaree, Queanbeyan-Palerang, Snowy Monaro, Snowy Valleys, Upper Lachlan and Yass, but all LGAs incorporate critical ecological values that are exposed and / or vulnerable. LAGs with high levels of sensitivity are those with endangered and critically endangered ecological communities.
From a fire risk perspective, the LGAs of priority are Snowy Monaro, Snowy Valleys, Queanbeyan-Palerang, Yass, Goulburn-Mulwaree and Wingecarribee. This is largely due to higher numbers of threatened species and for some LGAs, their location with regard to climatic zones.
From the flood risk perspective, Goulburn-Mulwaree followed by Wingecarribee are prominent LGAs in terms of exposure of natural environmental values.
Beyond these hazards, drought also has a significant impact on vegetation communities and system health. In the longer term, temperature increases and sea level rise may result in impacts on fruiting, flowering and marine and estuarine communities respectively. Further work in these areas is essential.
Stresses That Contribute to Vulnerability
Stresses, or sensitivities, are not hazards but are circumstances that can change or even amplify how a hazard or shock event impacts our community, economy or the environment.
Aside from climate-driven events and disasters, other long-term, insidious aspects of climate change include sea level rise, and more frequent and prolong periods of drought.
Socio-economic stresses include ageing populations, housing availability and affordability, rising homelessness, displaced workers, over-reliance on a single industry or small number of industries for employment or income. The loss of and damage to dwellings across the region following the Black Summer bushfires has amplified the effects of housing shortages in the region. Other issues include impacts on uninsured, underinsured and unapproved dwellings.


Environmental stresses might involve issues of water quality or availability, weed and pest outbreak or loss of biodiversity and environmental degradation.
Built environment and infrastructure stresses can include ageing infrastructure, increasing pressure on infrastructure networks, land use conflicts and limited physical and digital connectivity.
Stresses, in their multiple forms, can influence how and the degree to which hazard events are felt across different parts of communities as well as economic, built and natural environmental systems. Stress factors can be profound in the absence of a hazard or disaster event.
Stress on systems can limit our capacity to cope or adapt to different circumstances. What makes stress more difficult to identify is the inability to measure some attributes at the local scale, requiring proxy indicators to examine potential impact.
Over time, stresses will change across the region as a result of social, economic and environmental cycles. Current stresses identified by communities as part of the Resilience Blueprint engagement processes include:

increasing housing stress and homelessness
inflation
inability to attract skilled workforces
population fluctuations in response to trends
increasing mental health challenges and limited access to support services
limited access to public transport, education and health services
declining water quality of natural watercourses, and water shortages
limited telecommunications and digital connectivity across large areas of the region.

Risks in a Changing Climate
Across South East NSW, our climate is changing and this is impacting the frequency and intensity of hazards, and the interaction of climatic and weather factors with the landscape.
Climate modelling helps us to examine the implications for hazard likelihood, and gain a clearer understanding of potential future scenarios of exposure, vulnerability and potential impact. This enables us to plan for and work to mitigate and adapt to these potential consequences before they occur, making us more resilient into the future.
Climate modelling performed by Risk Frontiers as part of the formulation of this Resilience Blueprint has focussed on the specific climate projections for each LGA within South East NSW and for the region as a whole. This provides a clear view of the future climate context where we live and work.
Different emissions scenarios are considered as part of climate modelling, including, low, medium and high emissions scenarios. These scenarios are reflected by Representative Concentration Pathways (RCPs). RCP4.5 reflects the ‘medium’ emissions scenario
According to IPCC reporting, global surface temperature will continue to increase until at least the mid-century under all emissions scenarios considered. Global warming of 1.5°C and 2°C will be exceeded during the 21st century unless deep reductions in CO2 and other greenhouse gas emissions occur in the coming decades. It is virtually certain that increasing temperatures and energy within the climate system will result in wide- spread changes to weather and climate patterns.
Under the RPC4.5 scenario, which is the ‘medium’ rather than the worst case emissions scenario, by 2070 the South East region of NSW will see:

Overall, the region is expected to become drier and hotter, with increased incidence of drought. In alpine areas, reduced snow quality and length of season is also projected.
Hazards like bushfire and heatwave will become more frequent and intense under these conditions. When it rains, it may be concentrated, leading to flash flooding.
Cascading impacts will relate to water security and availability, the impacts of extremeheat on people, the natural environment, built environment and infrastructure. Storm damage, already a major cause of property damage and economic loss in NSW, will increase.
The magnitude of change varies across the region.
Further detailed consideration of current and future hazards and their risk dimensions follows, with additional information contained in the LGA-specific snapshots in the Blueprint Appendix.
ENABLING ADAPTATION IN THE SOUTH EAST (EASE)
To help the South East and Tablelands region adapt to the impacts of climate change, more than 150 state and local government stakeholders were brought together in 2014 as part of the NSW Government’s Enabling Regional Adaptation work. Participants collaboratively identified how different economic, socio-cultural and environmental aspects (also known as systems) in the region are vulnerable to climate change. For each of these systems, the vision for a climate-resilient future was identified, and opportunities for action were co- designed.Enabling Adaptation in the South East (EASE) report, published in November 2017, aims to use tacit local knowledge to identify regional climate vulnerabilities and develop workable and agreed pathways and projects that minimise the impacts of climate change on local communities and build resilience to future extreme events and hazards.Identified were aspects of existing (business-as-usual) regional systems which are resilient to climate change, and those which will need transition pathways to reach an ultimately transformed system in the future.

Regional Hazard and Risk Profile
The consideration of hazard exposure and vulnerability allows for the understanding ofour potential risks, from which we can consider our capability and capacity to cope and adapt. The following sections step through key hazard-related risks relevant to South East NSW.
Snapshot Overview
A snapshot of risk characteristics by hazard for South East NSW.
Severe storms, wind and hail
- The most frequent event type across the region
- Difficult to predict and with potentially high cost impacts
- Risk is widespread but particularly pronounced for coastal LGAs east of the main range

Bush and grass fire
- Generates significant damage to and loss of infrastructure and loss of life
- Major impacts on ecosystems
- Climate change is driving increased frequencies and intensity of bush fire events

Extreme rainfall and flooding
- Generates the greatest damage to infrastructure, highest fatalities and highest costs
- Flash flood and riverine flood risks are elevated for higher density population centres
- Climate change likely to influence flood heights into the future

Heatwave
- Generates the greatest damage to infrastructure, highest fatalities and highest costs
- Flash flood and riverine flood risks are elevated for higher density population centres
- Climate change likely to influence flood heights into the future

Coastal hazards
- Sea level rise, storm tide and storm surge relevant to coastal LGAs, with increased risk as a result of climate change
- Tsunami risk exposure is elevated for some parts of the coastline
- Exposure of infrastructure and assets is a key area of focus

Drought
- Chronic and widespread in nature, though local relief can occur at times
- Relationships between drought, mental health and wellbeing, community economic performance and environmental health
- The region is projected to become hotter and drier as a result of climate change, but impact is not uniform across all LGAs

Earthquake
- Rare in probability but high in consequence
- The region is a higher activity hot spot for geological activity than other parts of Australia, with a long history of tremors

Landslide
- Rare in probability but potentially high in consequence depending on location
- Risk is elevated for LGAs with steep topography

Biological
- Some rare events and other relatively common, of varying consequence
- Implications for public health and economic productivity
Severe storms, wind and hail
Storms are the most frequent hazard event experienced across the region, but only sometimes does damage occur as a result. When damage does occur, it tends to be substantial but over relatively localised areas.
Storms can produce heavy rainfall which leads to localised and flash flooding, gusting winds can damage buildings and hail can lead to costly property and crop damage or loss. Hail can also cause injury to humans and wildlife. They can also result in tremendous insurance costs which can have longer-term implications for policy holders.
Under present day climate, LGAs in the region are exposed to several types of storms, including east coast lows, extra-tropical lows, fronts, snowstorms, thunderstorms, and hailstorms. Some of the most severe impacts such as heavy rainfall, strong winds, and large waves and elevated ocean levels are associated with east coast lows. There is large year-to-year variability in storm activity, which is modulated by Indo- Pacific climate drivers. Storms tend to be more frequent during La Niña and Indian Ocean Dipole (IOD) negative periods and less frequent during El Niño IOD positive. This relationship is not expected to change under a warming climate.
East coast lows are one of the most damaging storm types to impact South East NSW and have most impact on near-coast LGAs including Eurobodalla, Bega Valley, Wingecarribee and Goulburn Mulwaree. However, many east coast low events transition over the mainland as cut-off lows where they can bring damaging winds and snowfall to low elevations affecting most LGAs in the region. East coast low frequency is expected to increase slightly under future climate projections, consistent with an expectation of increased large-scale interactions between warm and cool air masses as the climate warms.
Extra-tropical lows and associated fronts and thunderstorms can cause significant risk, especially during summer when they are a primary cause of dangerous bushfire ignition. Across the region, damaging winds are typically associated with the passage of extra-tropical storms and fronts. Windspeeds are strongest in the north-western LGAs including Wagga Wagga, Hilltops and Upper Lauchlan. It is noted that values are averages across each LGA, and windspeeds and individual locations, such as the Kosciuszko area, can be significantly higher than the LGA average.
Maximum annual windspeed is projected to increase across all LGAs in both near and mid-term projections, suggesting an increase in the strength of frontal systems, consistent with a projected increase in large-scale latitudinal temperature gradients as the climate system warms.
Some of the main issues and challenges associated with storms include beach erosion, disruptions to power and water supplies, disruption and damage to roads through treefall, downed power lines, landslips, washouts, and erosion. Cascading impacts can relate to more frequent emergency operations, greater demand on waste management, damage on council assets and resource and additional impacts associated with strong winds, extreme rainfall and flooding.
Potential for increased periods of storm activity combined with projected sea level rise will place addition stresses on coastal development and infrastructure. Storms such as east coast lows are also one of the main contributors to rainfall, and so can be beneficial in terms of recharging water supplies.
Snowstorm impacts are typically restricted to the higher elevation areas of Snowy Monaro and Snow Valleys, but occasionally (approximately 1-2 times per year) snow to low elevations can cause widespread disruptions to roads and traffic across many other LGAs.
Dust storms in the western parts of the region around Wagga Wagga come with their own unique impacts, not least of which includes the potential for respiratory distress and difficulties breathing in some cases.
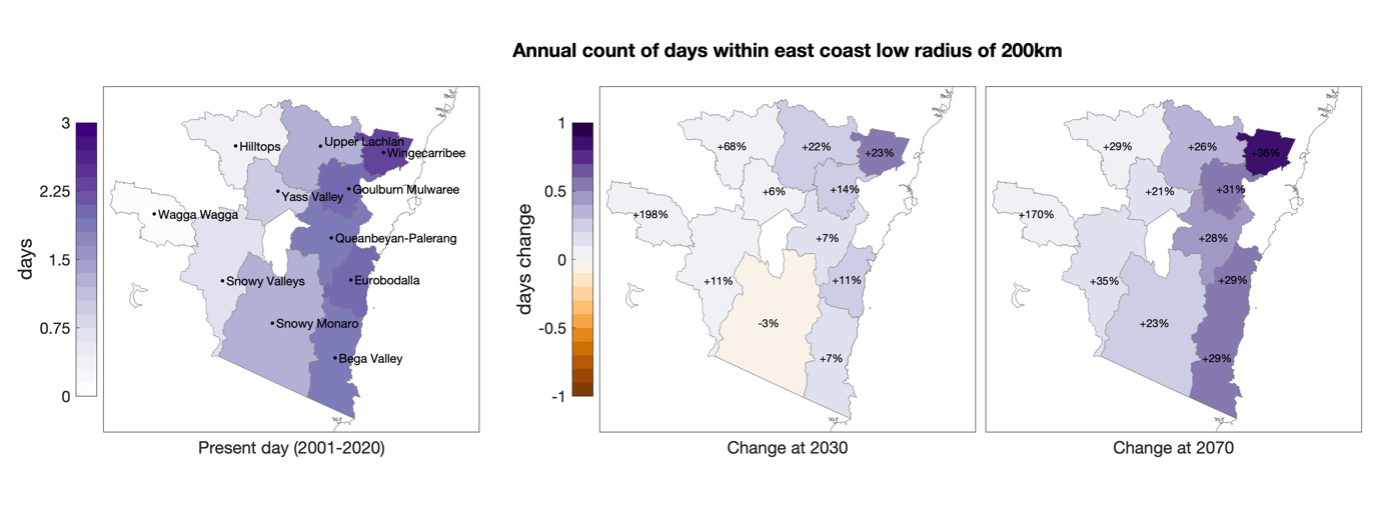
Figure 15 – Frequency of east coast low days. Values are 20-year averages centred on the displayed year, such that 2030 is the mean of 2021 to 2040. projections are the ensemble mean 20-year averages from a 2-3 degree warming scenario (RCP4.5)
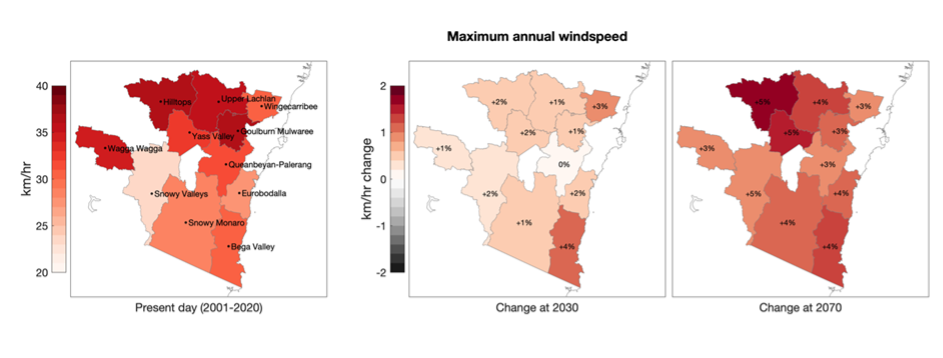
Figure 16 – Annual maximum windspeed (km/hr). Values are 20-year averages centred on the displayed year, such that 2030 is the mean of 2021 to 2040. Projections are the ensemble mean 20-year averages from a 2-3 degree warming scenario (RCP4.5)
Bush and grass fire
Bushfires and grassfires are a common hazard across the region, and the impacts over the years have been life-changing for many.
From the 2003 Canberra bushfires, one of the first instances of urban infiltration of bushfire in Australia, to the 2018 Tathra bushfire and the devastating 2019-20 Black Summer bushfires, the region has seen more than its share of damage, and loss.
Large expanses of the region comprise national parks, state forests, reserves and private bushland holdings. These areas, their ecosystems and biodiversity and the habitat they provide is of high value. It also a key attribute in our lifestyle decisions around where we live and how we recreate, and is a large part of how we self-identify.
Whilst records of emergency and disaster events has changed over time, and less events were characteristically captured in the early parts of the 1900’s, major fire events were recorded in Cooma and Delegate in 1904, across the region in 1939, in 1952 in Erina, the 1965 Tarlo / Chatsbury / Bungonia bushfires, the 2003 McIntyre’s Hut bushfire, 2017 Carwoola bushfire, and more.
Grassfires are also a common part of life on the land, with graziers and farmers equipped with farm units to quickly respond to fast-moving grassfires. Loss of valuable fodder, sheds and equipment is a key risk, hence the level of capability to deal with fire that exists across agricultural communities.
However in some conditions, decisions around the need to leave early need to be made.
Drought and extreme heat are priming factors that can be associated with major bushfire events in Australia. Across the South East region, climate projections for annual hot days, drought index averages and fire danger days will increase between now and 2070, meaning overall, the region is becoming more prone to fire conditions. The magnitude of bushfire weather extremes (daily maximum FFDI) will increase across all LGAs. The largest changes for bushfire weather across southeast Australia are expected to be occurring during the spring, with a projected earlier onset of the bushfire season under a warmer climate.


Figure 17 – Magnitude of bushfire weather severity as represented by the annual maximum FFDI. Values are 20- year averages centred on the displayed year, such that 2030 is the mean of 2021 to 2040. Projections are the ensemble mean 20-year averages from a 2-3 degree warming scenario (RCP4.5)
To adapt to this, we have to make decisions, develop plans and implement measures to mitigate our risk and our growing exposure.
We can do this through combined approaches that include risk-based land use planning, building provisions, natural areas management, cultural burning practices and caring for country more broadly, weed management, enhanced emergency awareness, property preparation and maintenance and household survival planning.
The 2020 Royal Commission and 2020 NSW Bushfire Inquiry both explored the benefits of ecological burning and putting good fire onto the landscape. Cultural burning practices were deployed across Australia prior to European colonisation, with a focus on maintaining healthy Country. Reading cues from Country to know when and where to burn, trickling fire across the landscape to regenerate food sources for wildlife and keeping undergrowth down, ultimately reducing the risk of large-scale and hot-burning bushfires.
Discussions with 29 First Nations people to inform the Resilience Blueprint affirms the need to embed care for Country as standard practice across Australia. This needs to be delivered through training of First Nations people and giving First Nations people a greater place in decision-making in land management activities, and beyond.
Extreme rainfall and flooding
Flooding is one of the costliest hazards in South East NSW, largely owing to its impact to essential infrastructure assets which can damage large stretches of roads, bridges, buildings, homes and cause significant agricultural losses.
Rainfall however is an important and valuable necessity for the landscape, community and economy. It replenishes terrestrial water storages, keeps water flowing through catchments and balances bushfire threat by moistening soils and vegetation.
Across the region, more than 147 flood studies have been prepared by local governments and other agencies to explore catchment-scale and localised flood risks. These studies help inform land use planning processes, infrastructure design and asset management activities, emergency management and environmental rehabilitation and protection measures.
Several types of floods can be experienced across the region, including riverine flooding where floodwaters inundate expansive floodplains, often yielding fertile soils so it is not surprising that agricultural activities are highly exposed.
Also present is localised flooding and flash flooding, where heavy rainfall over short periods of time lead to rapid inundation. This type of flooding can be fast-flowing, as runoff makes it way to local creeks and tributaries. Flash flooding can catch people off guard leading to dangerous situations, particularly for road users.
The region forms the headwaters of the Snowy, Murray, Murrumbidgee and Lachlan rivers, major waterway systems that form part of the Murray Darling Basin. Towards the coast, short-run coastal catchments are highly responsive to rainfall, and waterways can rise quickly with overland flow also creating localised flooding.
Major historical floods across the region include too many to name but include a cluster of events between 2020 and 2022 during a strong La Nina period, as a result of low pressure systems and complex slow-moving weather systems, several of which broke rainfall records.
The 2011 Bega and Moruya flood event and 2012 Murrumbidgee flood also occurred during a strong La Nina period which saw widespread flooding across eastern Australia. Over the years, both Bega and Moruya have experienced numerous flood events in 1925, 1945, 1961, 1971, 1992 and 1997.
Wagga Wagga, Yass, Queanbeyan, Goulburn and Cooma also carry long histories of flood-related events, some more damaging than others. Over time, some towns have constructed levees for flood protection up to certain flood levels, along with other mitigation efforts.
Frequency of very heavy rain days (over 30 millimetres) and maximum 1-day rainfall are indicative the frequency and intensity of rainfall extremes which can lead to a range of hazards including flooding, landslides, and damage to infrastructure including roads.
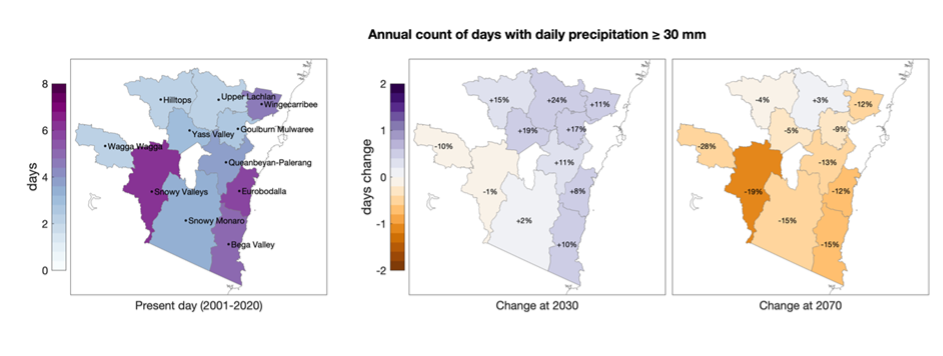
Figure 17 – Magnitude of bushfire weather severity as represented by the annual maximum FFDI. Values are 20- year averages centred on the displayed year, such that 2030 is the mean of 2021 to 2040. Projections are the ensemble mean 20-year averages from a 2-3 degree warming scenario (RCP4.5)
Under present day climate there are on average four very heavy rainfall days per year with highest frequency in Snowy Valleys and the coastal LGAs of Bega Valley, Eurobodalla and Wingecarribee. Maximum 1-day rainfall totals are highest at the coastal LGAs and are likely to be associated with east coast lows.

Figure 19 – Annual maximum 1-day rainfall total (millimetres). Values are 20-year averages centred on the displayed year, such that 2030 is the mean of 2021 to 2040. Projections are the ensemble mean 20-year averages from a 2-3 degree warming scenario (RCP4.5)
During the 21st century, the primary driver of year-to-year variability in rainfall will continue to be the tropical climate drivers of IOD, El Niño-Southern Oscillation (ENSO) and the interdecadal Pacific Oscillation (IPO). Projections for Pacific climate are indicating an increase in ENSO amplitude, meaning both El Niño and La Niña events will be stronger. Extreme rainfall events will produce higher rainfall totals due to the physical relationship between a warmer temperatures and higher atmospheric moisture capacity. Higher rainfall totals may lead to higher flood levels during flooding events, but the frequency of these events will not differ significantly from present. Whilst frequency may not differ, flood risk due to extreme rainfall events shows an increase due to a warmer atmosphere.
Heatwave
Extreme heat and heatwave is Australia’s leading cause of natural hazard life loss (Bureau of Meteorology (BoM), 2022). Heatwaves can be dangerous because they pose health risks to the most vulnerable, such as elderly people and very young children.Heatwaves can also affect the transport, agriculture and energy sectors and associated infrastructure (BoM, 2022).
A heatwave occurs when the maximum and the minimum temperatures are unusually hot over a three-day period at a location. This is considered in relation to the local climate and past weather at the location (BoM, 2022).
It takes more than just a high daily maximum temperature to define a heatwave. It is also about how much it cools down overnight. Hot days without hot nights allow some recovery from each day’s heat, but if the temperature stays high overnight, the maximum will be reached earlier the following day and will last longer. When unusually high night and daytime temperatures persist, heat stress becomes a critical factor in human health and whether infrastructure can function properly, and the likelihood of infrastructure or network failures as energy demand peaks (BoM, 2022).
Drought and heat were key preconditioning factors leading into the 2019-20 Black Summer bushfires, and this is a consistent phenomenon associated with most if not all major bushfire events in Australia. This also means that our adaptive capacity is drawn- down by dealing with these factors in advance which may mean we do not have enough physical, mental or emotional energy left in reserve to deal with cumulative events and impacts.
Across South East NSW, temperatures are increasing as a result of climate change (AdaptNSW, 2022). The CRJO region currently experiences an average of 8 days per year with temperature over 35 degrees Celsius, and the hottest daily temperature is on average 37degrees Celsius. By 2070 under RCP4.5 there is expected to be on average 14 days per year with temperature over 35 degrees Celsius, and the hottest daily temperature will be on average 39 degrees Celsius. Inland LGAs, especially Hilltops and Wagga Wagga, are more exposed to temperature extremes compared to more coastal LGAs.
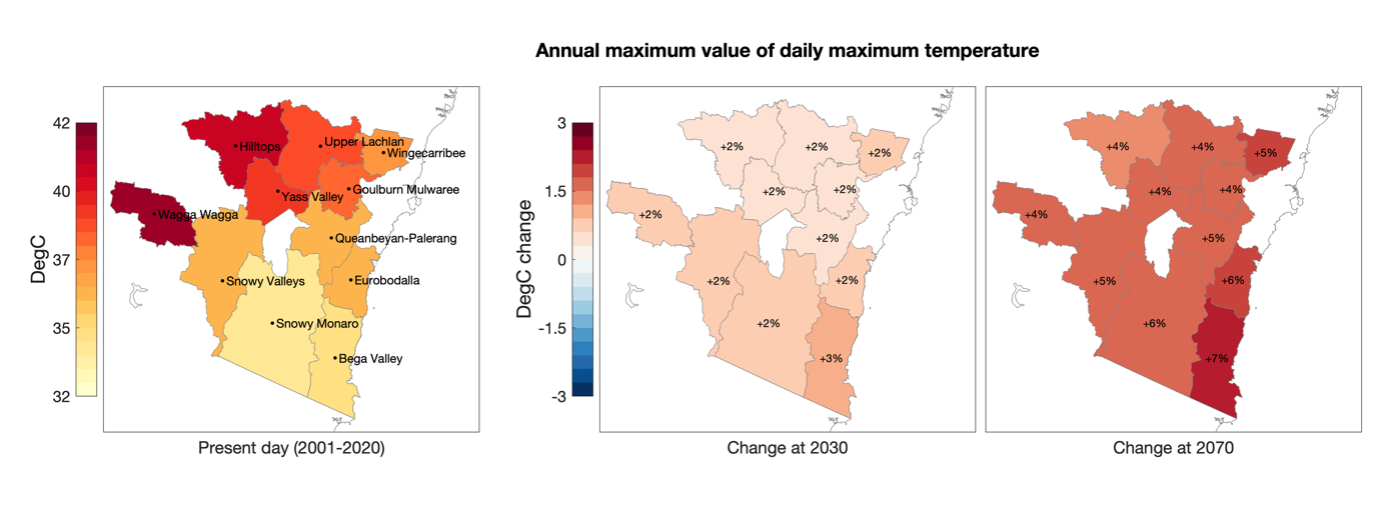
Figure 20 – Frequency of days per year with temperature exceeding 35 degrees Celsius. Values are 20-year averages centred on the displayed year, such that 2030 is the mean of 2021 to 2040. Projections are the ensemble mean 20-year averages from a 2-3 degree warming scenario (RCP4.5)

Figure 21 – Maximum temperature of the hottest day in degrees Celsius. Values are 20-year averages centred on the displayed year, such that 2030 is the mean of 2021 to 2040. Projections are the ensemble mean 20-year averages from a 2-3 degree warming scenario (RCP4.5)
Under future climate the frequency of hot days will increase most for the inland LGAs, whereas the magnitude of temperature extremes will increase most for the coastal LGAs of Bega Valley, Eurobodalla and Wingecarribee. Other extreme heat measures such as consecutive hot days and Excess Heat Factor (EHF) are not shown but were investigated and indicate similar increases under a warming climate.
The largest increases in heatwave and high temperature extremes will be seen during the summer months when it is already warmest. However high temperature extremes will also occur more frequently during spring and autumn.
With regard to the inverse and looking at frost nights, it is highest for inland and high elevation LGAs, such as Snowy Monaro. Little change is expected in the short term however, by 2070 there will be clear decreases in the frequency of frost nights across all LGAs, especially Snowy Monaro, Snowy Valleys, and Queanbeyan-Palerang.

Figure 22 – Frequency of nights per year with temperature <0 degrees Celsius. Values are 20-year averages centred on the displayed year, such that 2030 is the mean of 2021 to 2040. Projections are the ensemble mean 20-year averages from a 2-3 degree warming scenario (RCP4.5)
Projections for increases in hot days and heatwave days will create a range of issues and adaptation challenges for all LGAs, including increased maintenance costs for roads and public spaces, increased municipal water demands coupled with increased pathogen risk, serious disruptions to council productivity through work health and safety issues, energy usage, demands on emergency services and increased visitation to the coastal zones. The threat to human health from extreme temperature events will increase the need for adaptation measures to be included in planning and other decision-making.
The biophysical impacts of increased temperature will place additional stresses on ecosystem health in council-managed parks and reserves. Increasing temperatures also contribute to increasing risk from bushfire weather and drought.
Coastal hazards and risks
Two LGAs in the region are located on the coastline, including Eurobodalla and Bega Valley.
Our coastlines are dynamic and subject to constant change as a result of coastal processes and coastal hazards.
Coastal processes include elevated water levels, waves and currents both of which vary with tides, storms and the construction of structural protections (Eurobodalla Shire Council, 2017 and Bega Valley Shire Council, 2015).
Coastal hazards are complex hazards, driven by meteorological, hydrological, environmental and geological activities, including a combination thereof. For the most part they are commonly storm-related, where storm surge and storm tide cause coastal erosion as was the case during the 2016 east coast low event.
Coastal hazards can involve beach and dune erosion, shoreline recession, sand drift, coastal inundation, slope and cliff instability, unstable entrances and erosion and inundation of estuary foreshores from tides, waves and floodwaters (Eurobodalla Shire Council, 2017 and Bega Valley Shire Council, 2015).
Both Eurobodalla Shire and Bega Valley Councils have undertaken comprehensive coastal hazard and risk management plans to effectively plan for these hazards and their associated risks, including as a result of climate change.
Global mean sea level has risen faster since 1900 than over any preceding century in the past 3,000 years (IPCC, 2022). Around the Australian coastline, sea levels are currently rising at a rate of ~3.7 millimetre per year. Global sea levels are projected to continue rising throughout and beyond the 21st century under all scenarios. Projections are for up to 1m sea level rise by 2100 under RCP8.5 however, uncertainty about ice sheet response means this could be a significant underestimation. For context, global sea levels have risen over 120 metres since the peak of the last ice age, therefore a rise of more than 1 metre in the coming century would not be unusual.
The frequency of tsunami in NSW is very low but the consequences can be extreme. A tsunami is a series of waves that can be generated by sea-floor earthquakes (most common), sub-marine or coastal volcanic eruptions, meteor impacts and coastal landslides and slumps (State Emergency Service (SES), 2022).
Australia has been affected by over 50 tsunami in the past 200 years. The largest Tsunami to have affected the NSW coast in recent times occurred in May 1960 after a 9.5 magnitude earthquake in Chile resulted in a 1 metre tidal fluctuation at Fort Denison in Sydney Harbour. This caused widespread damage to marine infrastructure along the NSW Coast including damage to boats, wharves, jetties and beaches (SES, 2022).
The Joint Australian Tsunami Warning Centre monitors earthquakes that could potentially cause tsunami, and issues warnings accordingly. The NSW SES in partnership with local governments, has developed evacuation areas across most coastal areas of NSW which can be accessed via the NSW SES website.
Understandably, large stretches of the Eurobodalla and Bega Valley coastlines are exposed to various coastal processes and hazards, though vulnerability varies depending on the extent of coastal development and marine industries that are established in various locations.

Drought
Drought is regarded as one of the most challenging recurring conditions in Australia, with profound consequences for human health, mental health more specifically, and for the economy.
Drought is pervasive, recurring and distressing. It is difficult to determine a start and end, and when the landscape has recovered. As for other disasters, they are difficult to predict or compare with differences in seasonality, extent, duration, severity, among other variables all contributing to the drought experience.
Australia has highly variable rainfall records and in contrast also has highly variable periods of low rainfall.
The Bureau of Meteorology has four definitions of drought, which are:

meteorological

agricultural

hydrological

socio-economic
There are also different phases of drought. The initial phase is a ‘non-drought’ category where all indicators suggest good conditions for production to recover, through to a ‘drought affected’ (weakening or intensifying) category, a ‘drought’ category and into an ‘intense drought’ category where rainfall, soil water and plant growth are below the 5th percentile (DPI, 2018).
There is a significant history of drought in South East NSW. Rainfall across the region is variable, with an average of around 600 millimetres per year. However, as locals know, there is no such thing as ‘average’ conditions in this part of the world.

Figure 23 – Total annual precipitation in millimetres per year. Values are 20-year averages on the displayed year, such that 2030 is the mean of 2021 to 2040. Projections are the ensemble mean 20-year averages from a 2-3 degree warming scenario (RCP4.5)
Some of the most impactful droughts in Australian history have affected South EastNSW. These include:

In all cases these drought events were characterised by protracted periods of low rainfall, leading to low soil moisture and strong relationships with heatwave and fire weather conditions.
Because the future is uncertain, climate models help us to consider potential future scenarios to support resilience plans that account for multiple situations that may eventuate. Scenarios are also a powerful way to explore how drivers of change or trends, be they socio-demographic, economic or environmental, may influence possible futures of the region, and how these may interact with the impacts of drought.
Drought conditions are expected to worsen across South East NSW under a warming climate. Across the region, inland LGAs, especially Wagga Wagga, Hilltops and Yass Valley, are more exposed to drought compared with coastal LGAs and higher altitude LGAs. Under future climate projections, by 2070 the magnitude of drought will increase across all LGAs and especially those already most affected being Wagga Wagga, Hilltops, Yass Valley and Upper Lachlan. Soil moisture declines by 2070 are modelled for all seasons, with the greatest during the winter and spring.

Figure 24 – Annual mean Keetch-Byram index value normalised on a scale of 0-10, where 10 is the maximum drought possible. Values are 20-year averages centred on the displayed year, such that 2030 is the mean of 2021-2040. Projections are the ensemble mean 20-year averages from a 2-3 degree warming scenario (RCP 4.5)
Total annual rainfall is also a major factor in regional water security and drought. Under present day climate, total annual rainfall across South East NSW is 744 millimetres per year and tends to be lowest at the more inland and lower elevation LGAs of Wagga Wagga, Hilltops, and Upper Lachlan, and higher at Snowy Valleys and coastal LGAs of Bega Valley, Eurobodalla and Wingecarribee. Under future climate projections, by 2070 rainfall may decrease in the spring, and could possibly increase during summer.
Changes in total annual rainfall are less than the projected changes in soil moisture and drought, suggesting that the increase in drought is being driven primarily by increasing temperatures and their effect on evapotranspiration.

Figure 25 – Annual mean soil moisture percentiles. Values are calculated relative to the WMO 30-year standard reference period of 1991-2020. Low values at 2070 are indicative of a drying landscape. Values are 20-year averages centred on the displayed year, such that 2030 is the mean of 2021 to 2040. Projections are the ensemble mean 20-year averages from a 2-3 degree warming scenario (RCP 4.5)
Projections for increases in drought intensity will create a range of issues and adaptation challenges for most LGAs, including decreased flow into catchments, reducing water availability while increasing demand for municipal, industrial and irrigation requirements. Severe and protracted drought also increases the risk of soil compaction and damage to subsurface infrastructure such as sewer and water mains and contributes to socio-economic stressors, especially to the agricultural sector.
Landscape-wide drought threatens ecological systems and is a leading factor in forest dieback. Dry landscapes are also more susceptible to bushfire. Much of South East NSW cultural heritage is connected to the biophysical environment. Drought and increased risk for forest dieback and bushfire may threaten important cultural heritage, including scar trees.
DROUGHT RESILIENCE PLANNING
The Regional Drought Resilience Plan is a collaboration between Hilltops Council and Upper Lachlan Shire Council, working together to advance the region’s focus on and future resilience to the impacts of drought. The Drought Resilience Plan is a sister plan of the Resilience Blueprint, and helps the entire region to adapt to the specific impacts of drought.It is one of three initial drought resilience planning pilots in NSW which will help guide local and regional approaches across the rest of the state. The NSW RDRP program is jointly funded through the Australian Government’s Future Drought Fund and the NSW Government, supporting local governments to work together regionally to plan for drought resilience proactively and pragmatically.

Earthquake
Whilst relatively infrequent, earthquakes occur across the region, creating significant damage,. In 1860, a magnitude 5.0 earthquake occurred in Yass which caused minor damage at the time but fast-forward to today, an earthquake of that magnitude could lead to substantial damage and loss. The earthquake could be felt as far away as Bathurst and Queanbeyan, with four aftershocks also felt (Yass Courier, 1860).
Also in 1860, a separate earthquake was reported in Araluen with events in subsequent years in Queanbeyan in 1872 at an estimated magnitude of 3.5, and 1883 between Crookwell and Goulburn with an estimated magnitude of 5.2 (McCue, 2013).
Further events have been reported in Berridale in 1885 at a magnitude of up to 4.7, a 5.3 magnitude event in 1893 in Tumut and a 3.5 magnitude event in 1894 in Cooma, and two events in 1897 in Queanbeyan and Cooma. An event in 1902 in Young reportedly startled sleeping residents during the night (McCue, 2013).
In 1910 a magnitude 4.5 earthquake occurred, its epicentre near Adaminaby, but felt from Kosciuszko to Queanbeyan. Cooma was once again shaken in 1931, however a major event also occurred in the same year with an epicentre near Boorowa which resulted in a landslip at Mt Bobbra where about two acres of land fell into a valley. Heavy rainfall in the same period is likely to have contributed to the landslip. The earthquake was felt in Yass and Binalong (McCue, 2013).
In 1933, a magnitude 4.8 earthquake in the Dalton / Gunning region caused substantial damage to homes and other buildings and felt as far away as Bondi and recorded on seismographs at the Sydney and Riverview observatories. More than 21 aftershocks were felt across the region. This event was the first of a 50 year period of high seismic activity in the region including two separate events at Harden and Gunning in 1935, Canberra in 1940 and Crookwell again in 1954 (McCue, 2013).
The South East NSW region forms part of Australia’s most earthquake-prone regions according to Geoscience Australia’s National Seismic Hazard Assessment 2018. This assessment defines the level of earthquake ground shaking across Australia that has a likelihood of being exceeded in a given time period. Knowing how the ground- shaking hazard varies across Australia allows higher hazard areas to be identified for the development of mitigation strategies so communities can be more resilient to earthquake events (Geoscience Australia, 2018).

Figure 26 – 10 per cent in 50 year seismic hazard mapping (Source: Geoscience Australia, 2018)
The South East’s probability of earthquakes in part owes to its proximity to Lake George which is one of Australia’s most active faults measuring over 80 kilometres in length from around Goulburn to Queanbeyan. The smaller Queanbeyan Fault and another at Murrumbidgee are also active but noting, seismic activity is measured in time scales of hundreds, thousands and into millions of years (Geoscience Australia, 2018).
The 1989 Newcastle earthquake measured a magnitude 5.6 on the Richter Scale and is one of the worst disasters in Australian history. The Newcastle earthquake catalysed sweeping changes to Australian building standards. Whilst building standards for earthquake were originally introduced in 1979 it only applied to an area of Western Australia. The Building Code of Australia was revised in 1994 following research after the Newcastle earthquake and its impacts, introducing earthquake provisions across Australia.
Landslide
Landslide, landslip and subsidence is of a low likelihood across the region, but it can and has occurred, and will continue to do so over time. Landslides can occur for a range of reasons, including as a result of earthquakes, after heavy rainfall and due to poor soil drainage. It can also occur in disturbed areas where vegetation, which holds soils in place, is removed or cleared.
Historical events in the region include land slippage following earthquakes in the 1900’s, and following the 2019-20 Black Summer bushfires, particularly in the Snowy Valleys region, where slopes and hillsides gave way, damaging roads and causing periods of isolation for some residents and communities. The loss of vegetation and impacts to soils led to significant erosion and instability which was exacerbated when rain fell shortly after the fires.
The most devastating landslide event in Australia was the Thredbo disaster in 1997 which claimed the lives of 18 people, with one survivor, in the Snowy Mountains. The landslide occurred at 11:40pm when part of a road embankment slid down the steep hillside into a ski resort village.
Landslide is a cascading risk which usually has a strong association with another hazard, like an earthquake or heavy rainfall but steep slope and soil assessments can support engineering measures where appropriate, and help to avoid inappropriate risk where relevant.
Biological hazards
Biological hazards are relevant to people and other living organisms.
From a human health perspective, epidemics involve the rapid spread of infection disease. Epidemics become pandemics with the expansion to worldwide populations affecting large numbers of people.
These biological hazards generate significant pressures in terms of public health, health care systems and mental health. From a disaster perspective many cascading risks are often associated including economic, supply chain and cultural and human behavioural challenges.
These occurrences are generally of low frequency but when they do occur the breadth and depth of impact is widespread as has been the case during the COVID-19 global pandemic. Its impact has brought with it added complexity for recovery efforts from years of persistent drought, the Black Summer bushfires and more recent flood events. These events have shown the importance of building resilience to systemic and cumulative disaster risk.
Disease spread and human health risks are also common after other types of disaster events, particularly where drinking water and sanitation infrastructure networks are disrupted, damaged or lost.
Impacts from disaster impacts on industrial activities and land uses can also lead to human health concerns, as well as contaminating land and waters.
Beyond human health, impacts of biological hazards are vast and common for plants and animals, and the ecosystems on which they rely. Hence the value of and commitment to biosecurity controls across South East NSW. Weed and pest outbreak are continuous areas of focus from a property level through to government policy and industry practices. Animal disease is a key challenge, as well as exotic plant diseases and spread of exotic pest animals. Strong biosecurity measures at all levels is paramount in avoiding, mitigation and managing plant and animal biological hazards.

Indicators of Preparedness
The Get Ready NSW Baseline Research project was commissioned by the NSW Rural Fire Service (NSWRFS) to provide a quantitative analysis and insights into the preparedness of NSW households to respond and react to the threat of bushfire, home fire, flood or storm.
A total of 4,937 telephone interviews were conducted between 13 August and 6 October 2020. The data was aggregated at the Joint Organisation (JO) of Council level with Canberra Region Joint Organisation accounting for 13 per cent of responses.
A framework of six levels of preparedness were developed, with a ‘level 0’ representing a household that did not believe they were at risk from particular hazard, to ‘level 5’ where a household has a detailed plan, have initiated some actions to prepare their home in case of a hazard and have engaged in advanced preparatory actions and / or are involved in advocacy or volunteering related to hazard preparedness.
Key insights drawn from the survey for the South East NSW region include:
of the four target hazards in the region, most respondents were more likely to believe they were at threat from bushfire (43 per cent stating the threat was high or very high) or severe storm (36 per cent stating the threat was high or very high). This compared to 6 per cent for a house fire and 3 per cent for flood.
the results indicate the younger age cohort (18-29 years) and older age cohort (70+ years) are the least prepared. The researchers behind the survey hypothesise that the younger (18-29) age cohort is less prepared to a lack of experience or knowledge, while amongst the older (70+) age cohort there could be physical challenges with implementing plans or a lack of social connection, leading to being less prepared.
members of the culturally and linguistically diverse (CALD) community (identified by the survey by those who speak a language other than English at home) had significantly lower levels of preparedness for a bushfire and flood than those who speak only English.
preparedness for flood was considerably lower than preparedness for all other hazards with 64 per cent of households identifying themselves at ‘level 0’. That is, they consider they are at a very low or no risk of flood.
The above provides some interesting insights, particularly in light of flood risk which is the leading risk in the region in terms of fatalities and infrastructure costs, but preparedness for flood in the region is considerably lower than for other hazards.
In real terms, preparedness for disaster tends to increase immediately following an event, as perceptions, experiences and concerns are heightened. Over time, levels of resilience and preparedness can be affected by complacency as time passes by without impact.
What we are starting to see however, are consecutive and compounding events that are limiting our ability to recover before we experience another shock or stress. This creates other challenges for our levels of resilience, as fatigue increases.